Differential scanning calorimetry (DSC) is a thermal analysis method that measures the difference between the rate of heat flow into a specimen and into a reference, measured as a function of temperature or time while both the specimen and reference are exposed to the same temperature control program.
For example, when the specimen melts during the heating process, the DSC signal displays an endothermic peak. The characteristic temperature and enthalpy of melting can be identified from the peak.
There are two DSC measurement methods:
Heat Flux DSCs
A technique in which the temperature of the sample unit, formed by a sample and reference material, is varied in a specified program, and the temperature difference between the sample and the reference material is measured as a function of temperature.
Power Compensation DSC
A method in which the variation of thermal energy that has been applied to the sample and the reference material per unit of time is quantified as a function of the temperature to balance their temperature, while the temperature of the sample unit, developed by the sample and reference material, is changed in a specified program.
How Does DSC Work?
As Heat Flux DSCs are the most popular DSCs, this article will focus on describing how this works. The sample to be examined and a reference are placed in a DSC furnace and the temperature of the furnace is altered under controlled conditions. The temperature difference between the reference material and the sample is quantified as a function of the applied temperature.
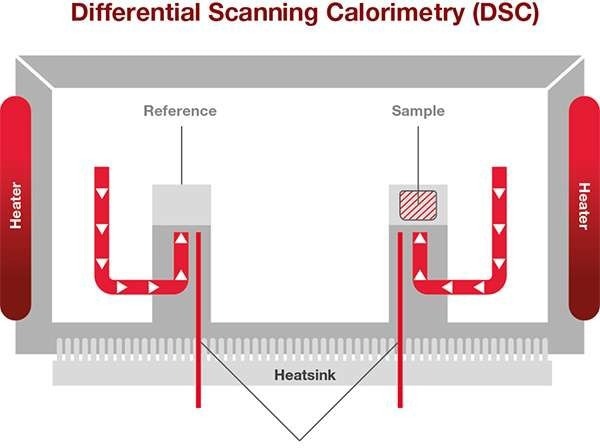
Thermocouples detect the temperature difference. Image Credit: Hitachi High-Tech Analytical Science Ltd
The variation in temperature between the sample and the thermally stable reference denotes changes in the state within the sample.
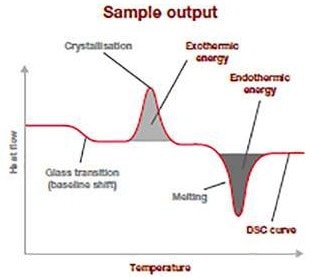
Image Credit: Hitachi High-Tech Analytical Science Ltd
The sample output thermogram given above demonstrates the normal data from a DSC analysis run. It is a plot of the temperature variation (heat flow: Y-axis (mW/mg)) concerning the increasing applied temperature (X-axis).
The baseline shift displays at what temperature the glass transition is occurring and how much energy is needed for it to occur.
The spread and position of the exothermic peak provide data on the cold-crystallization temperature and its energy discharge. The endothermic peak pertains to the temperature of fusion and how much energy was needed to go through this thermal transition.
This information enables users to verify — for example — polymer ID, crystallinity, quality, and purity and is an outstanding raw material quality check.
The sample and reference holders, heat resistor, heat sink, and heater are all part of a heat flux DSC. The heat of the heater has been transferred into the sample and the reference through the heater resistor and the heat sink. Heat flow is proportional to the heat difference between the holders and the heat sink. The heat sink has enough heat capacity compared to the sample.
The sample in this situation undergoes exothermic or endothermic phenomena like transition and reaction. This exothermic or endothermic phenomenon will temporarily change the sample temperature from the programmed temperature.
Hence, the temperature of the sample will be varied to the reference that is thermally inert. The variation in the sample and the reference temperature are proportional to the energy needed or released to go through a thermal event.
The temperature and energy required to go through a thermal event can be calculated accurately and precisely by calibrating the instrument with the assistance of a reference standard.
What Thermal Properties Does DSC Give Information About?
DSC allows for measurement transitions like melting, glass transition, and crystallization. Moreover, chemical reactions like thermal and UV curing, heat history, purity analysis, and specific heat capacity (Cp) are quantifiable.
With the evolution of highly functional polymeric materials in recent years, the investigation of subtle changes in thermal properties has expanded significantly.
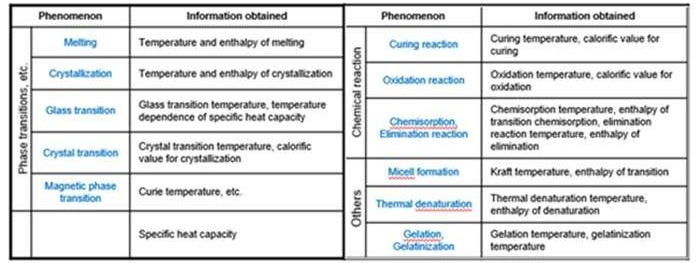
Outlined below is a list of phenomena that can be measured by DSC and the information obtained.
Source: Hitachi High-Tech Analytical Science Ltd
Two of the primary fundamental material properties that identify the suitability of a material for a given application are glass melting and transition.
The glass transition temperature (Tg) is the temperature at which a material changes from its glassy (hard) state to its rubbery (soft) state and vice versa. The glass transition can be found in materials containing an amorphous phase that is in insufficient supply.
Its temperature and how much a material is amorphous can be controlled through its process or by adding additives that will give the required material mechanical property. Determining the glass transition provides the upper and lower temperature limits for materials for production parameter optimization, quality control, and failure analysis.
Melting point (Tm) indicates the temperature points when the first detectable liquid phase is spotted to the temperature at which no solid material is left. Melting points can be detected in crystalline and semi-crystalline materials, and their melting enthalpy can be used to measure the degree of purity and crystallinity in materials.
How to Interpret Results for a DSC Specific to an ASTM Method
Hitachi has used ASTM E794-06(2018) - the standard test method for melting and crystallization temperatures by thermal analysis - as an example when it comes to interpreting outcomes.
This test method explains the determination of melting (and crystallization) temperatures of pure materials using differential thermal analysis (DTA) and differential scanning calorimetry (DSC).
The DSC thermograms below display how this method has the potential to distinguish between various types of polymers. Polymers have different melting temperatures based on their type but also on their composition (type or concentration of additives).
The following example displays two kinds of polyethylene (high and low density), which exhibit different melting point temperatures. The melting temperature of polymers is measured at the peak of the melting process.
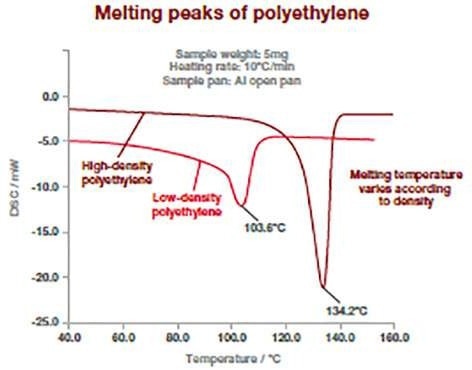
Image Credit: Hitachi High-Tech Analytical Science Ltd
This measurement can be utilized to verify incoming raw materials identification, detect traces of impurities (for example, polypropylene in polyethylene), and determine final product specifications. It is suitable for powders, pellets, or films.
What are the Advantages of Using DSC?
DSC, the most widely used among the four thermal analysis methods, detects a wide range of transitions due to its large temperature range. It is very simple to quantify transitions in materials, particularly in polymers where glass transition is significant.
Hitachi’s Range of DSC Analyzers for Visibly Better Thermal Analysis
The NEXTA DSC instruments provide first-in-class sensitivity and baseline reproducibility, offering highly precise testing and the potential to assess even the smallest thermal events.
The innovative Real View® camera system offers real-time observation at the time of measurement, enabling color analysis, dimension change measurement, and an understanding of unexpected results.
Having access to images of a sample during the measurement also helps when it comes to sharing results with colleagues and customers who might not know how this technique works.
The DSC200 offers leading technology for routine applications without limitations and is ideal for various applications.
The DSC600 is designed to meet the most advanced materials development and failure analysis needs thanks to its sensitivity and resolution, especially within applied research.

This information has been sourced, reviewed and adapted from materials provided by Hitachi High-Tech Analytical Science.
For more information on this source, please visit Hitachi High-Tech Analytical Science.