The demand for lithium extraction on a global scale is experiencing notable growth, primarily driven by the increased utilization of consumer electronics and vehicles that heavily rely on lithium-ion batteries. Lithium is sourced from both hard rock and underground brine deposits.
The extraction process involves obtaining brine from salt-encrusted depressions in the earth called salars. This brine is subsequently concentrated through solar evaporation in ponds.
To obtain lithium carbonate, soda ash or lime is employed for precipitation, and further processing yields lithium hydroxide, utilized in applications such as new high-nickel battery cathodes.
This extraction procedure encompasses several discrete stages, necessitating diverse materials that must be thoroughly analyzed and monitored. Alkaline solutions, calcium carbonate, and sodium carbonate are some of these substances.
Although lithium cannot be measured using wavelength dispersive X-Ray fluorescence (WDXRF) spectroscopy, the other component elements (such as calcium, potassium, and sodium) may be accurately analyzed using wide-concentration-range calibration curves.
WDXRF represents a highly prevalent technique for analyzing geological base materials, owing to its accuracy, precision, broad dynamic range of concentrations (from ppm to 100%), and overall simplicity compared to alternative analytical methods.
Thermo Fisher Scientific has devised a specific calibration tailored for lithium-salt applications based on their well-known "Soils and Sediments" factory calibration.
Instrument
The analyses presented in this article utilized a Thermo Scientific™ ARL PERFORM’X™ WDXRF Spectrometer with a power capacity of 4,200 watts. This system incorporates six primary beam filters, four collimators, up to nine crystals, two detectors, and a helium purge.
A notable component of this spectrometer is the 5GN+ Rh X-Ray tube, which demonstrates exceptional performance across a broad spectrum of elements, ranging from ultra-light to heavy elements, owing to its 50 µm beryllium window.
The tube has a low-current filament, ensuring heightened analytical stability over extended periods.
Tailored for rigorous laboratory requirements, the ARL PERFORM’X Spectrometer features dual sample loading, effectively reducing analysis time, and enabling rapid and precise analysis of up to 84 elements.
The system prioritizes performance and sample-analysis safety through its innovative LoadSafe design, encompassing safety features to facilitate reliable sample pumping and loading.
For instance, liquid cassette recognition prevents inadvertent exposure of liquid samples to vacuum, while an over-exposure safety mechanism automatically ejects a liquid sample in the event of prolonged X-ray exposure time.
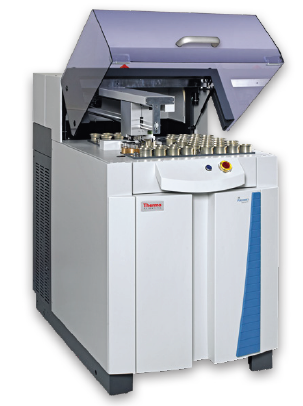
The Thermo Scientific ARL PERFORM’X WDXRF Spectrometer. Image Credit: Thermo Fisher Scientific - Elemental Analyzers and Phase Analyzers
Incorporated within the ARL PERFORM’X Spectrometer is the Secutainer System, a notable feature that safeguards the primary chamber by collecting any loose powder in a specially designed container. This container can be easily removed and cleaned, ensuring efficient maintenance.
The spectrometer ensures additional protection for the spectral chamber by including a helium shutter. Specifically designed for absolute protection, this feature safeguards the goniometer during liquid analysis conducted under a helium environment.
An exclusive X-Ray tube shield is provided for those opting for the "LoadSafe Ultra" configuration, offering enhanced protection against potential sample breakage or liquid cell rupture.
To address diverse analytical requirements, the ARL PERFORM’X Spectrometer offers optional small spot analysis and elemental mapping in 1.5 mm or 0.5 mm sizes.
Incorporating these tools expands the XRF system's capabilities, enabling additional screening, contamination identification, inclusion analysis, and segregation/non-homogeneity mapping.
Sample Preparation
Trace-element XRF analysis typically avoids using fusion-bead preparation for mineral samples due to the dilution ratio, which hinders the determination of very low concentrations (around 1–10 ppm). As an alternative, pressed pellets serve as a more suitable sample preparation method for this type of analysis.
In this context, the physical effects of pellet formation on the accuracy of results were found to be insignificant for the current analysis.
The samples were subjected to drying and mixing with 10% by weight of Hoechst wax C micropowder (MilliporeSigma). These mixtures were then pressed at a force of 20 tons for 20 seconds, resulting in the production of 40-mm diameter pellets with a thickness of approximately 5 mm. (Figure 1)
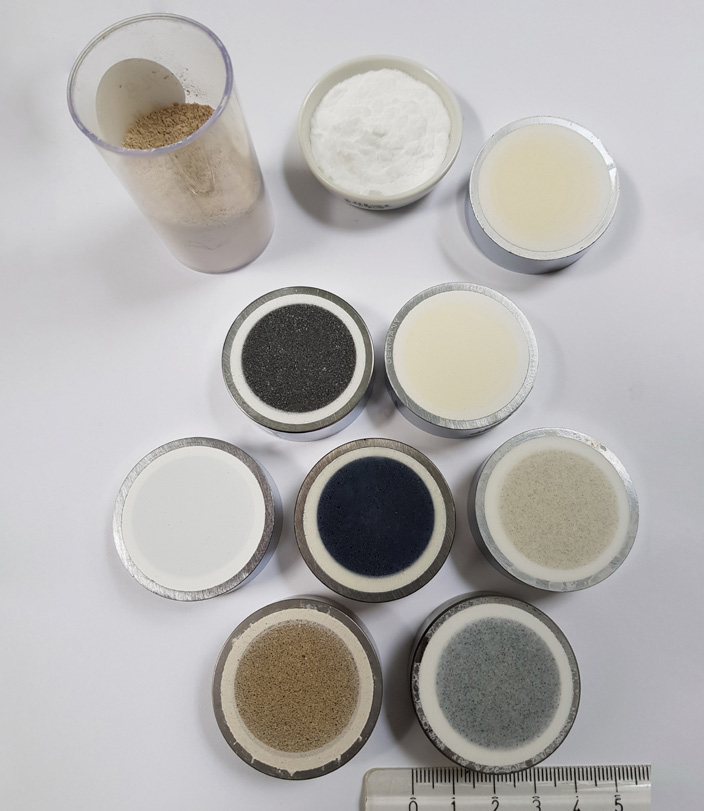
Figure 1. Pressed mineral sample pellets prepared for XRF analysis. Image Credit: Thermo Fisher Scientific - Elemental Analyzers and Phase Analyzers
Calibration and Results
Additional samples of materials commonly employed in the lithium-salt extraction process were used to fine-tune the standard "Soils and Sediments" calibration (XR-CALSEDI). Since certified reference materials (CRMs) for lithium-salt compounds are not readily available, raw materials were utilized to extend some calibration ranges.
Various materials, including KCl, CaCO₃, Li₂CO₃, CaSO₄, and diverse lithium-salt samples, were prepared as pressed pellets. To establish a working curve for each element, the Thermo Scientific™ OXSAS™ Software was employed, which utilizes multi-variable regression for calibration.
The matrix corrections involved theoretical alpha factors, and elements not measurable by WDXRF were defined through manual input. Accurate analysis of trace elements in geological samples relies on the instrument's sensitivity, resolution, and background/overlap correction functions.
The ARL PERFORM’X Spectrometer demonstrated its capability for achieving accuracy and precision, exemplified in Figures 2 and 3, attributed to the background correction of its digital goniometer and unique optical design. Background correction was predominantly used in analyzing most elements in this article.
The total analysis time can be reduced by omitting non-essential elements or those not present in certain compounds to tailor the analysis according to specific experimental requirements. In this context, quantification of the primary elements in the lithium raw materials was achieved in less than six minutes.
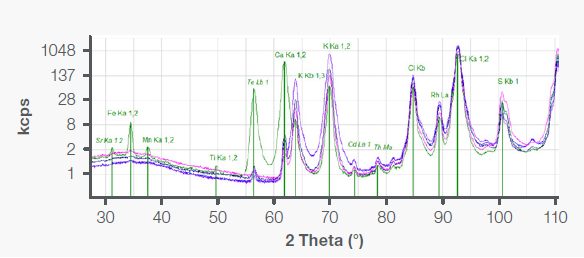
Figure 2. 2θ pack scan from 28 to 108 degrees using a Ge111 crystal and flow-proportional detector. Image Credit: Thermo Fisher Scientific - Elemental Analyzers and Phase Analyzers
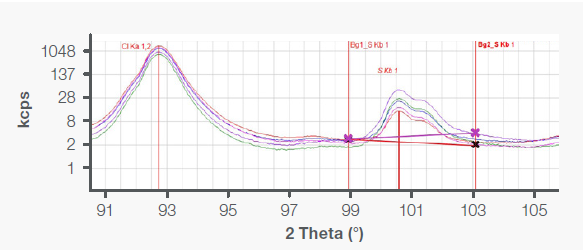
Figure 3. Close up of the 90–105° 2θ region in Figure 2. Image Credit: Thermo Fisher Scientific - Elemental Analyzers and Phase Analyzers
Table 1. Results of pressed pellet analysis with working concentration ranges for each compound. Source: Thermo Fisher Scientific - Elemental Analyzers and Phase Analyzers
| Compound |
Line |
Analytical ranges |
SEE |
LoD (ppm) |
Time (s) |
| Ag |
Ag Kα |
LoQ–35 ppm |
2.5 ppm |
2.5 |
40 |
| Al₂O₃ |
Al Kα |
LoQ–15.7% |
0.47% |
|
20 |
| As |
As Kβ |
LoQ–620 ppm |
21 ppm |
2 |
20 |
| Ba |
Ba Lβ |
LoQ–0.12% |
48 ppm |
2 |
40 |
| Bi |
Bi Lα |
LoQ–90 ppm |
1.3 ppm |
0.8 |
40 |
| CaO |
Ca Kα |
LoQ–31.5% |
0.15% |
|
20 |
| Cd |
Cd Kα |
LoQ–78 ppm |
8 ppm |
2.5 |
40 |
| Ce |
Ce Lβ |
LoQ–192 ppm |
12 ppm |
3.8 |
40 |
| Cl |
Cl Kα |
LoQ–58.8% |
1.4% |
|
40 |
| Co |
Co Kα |
LoQ–81 ppm |
2.7 ppm |
0.6 |
40 |
| Cr |
Cr Kα |
LoQ–0.43% |
21 ppm |
0.6 |
40 |
| Cu |
Cu Kα |
LoQ–0.5% |
35 ppm |
0.5 |
40 |
| F |
F Kα |
LoQ–0.19% |
120 ppm |
|
40 |
| Fe₂O₃ |
Fe Kα |
LoQ–28.2% |
0.48% |
|
20 |
| Ga |
Ga Kα |
LoQ–27.4 ppm |
1.2 ppm |
|
40 |
| Hg |
Hg Lα |
LoQ–10 ppm |
2 ppm |
1.4 |
40 |
| K₂O |
K Kα |
LoQ–51.7% |
44 ppm |
|
20 |
| La |
La Lα |
LOQ–90 ppm |
3 ppm |
|
40 |
| MgO |
Mg Kα |
LoQ–8.26% |
0.44% |
|
20 |
| Mn |
Mn Kα |
LoQ–1.01% |
0.01% |
0.7 |
40 |
| Mo |
Mo Kα |
LoQ–92 ppm |
2 ppm |
0.4 |
40 |
| Na |
Na Kα |
LoQ–41% |
0.12% |
|
30 |
| Nb |
Nb Kα |
LoQ–95 ppm |
1.3 ppm |
0.3 |
40 |
| Ni |
Ni Kα |
LoQ–280 ppm |
3 ppm |
0.7 |
40 |
| P |
P Kα |
LoQ–0.3% |
76 ppm |
|
40 |
| Pb |
Pb Lβ |
LoQ–0.55% |
78 ppm |
1.2 |
40 |
| Rb |
Rb Kα |
LOQ–470 ppm |
6 ppm |
0.3 |
40 |
| S |
S Kα |
LoQ–33.9% |
0.21% |
1.2 |
40 |
| Sb |
Sb Lβ |
LoQ–38.4 ppm |
0.6 ppm |
3.5 |
40 |
| Si |
Si Kα |
LOQ–77.3% |
1.4% |
50 |
10 |
| Sn |
Sn Lα |
LoQ–370 ppm |
11 ppm |
3.5 |
40 |
| Sr |
Sr Kα |
LoQ–340 ppm |
16 ppm |
0.5 |
40 |
| Th |
Th Lβ |
LoQ–70 ppm |
2 ppm |
0.6 |
40 |
| Ti |
TiO₂ |
LoQ–0.86% |
0.017% |
|
20 |
| U |
U Lα |
LoQ–17 ppm |
1.3 ppm |
1 |
40 |
| V |
V Kα |
LoQ–346 ppm |
5 ppm |
0.5 |
40 |
| W |
W Lα |
LoQ–126 ppm |
3 ppm |
|
40 |
| Y |
Y Kα |
LoQ–67 ppm |
5 ppm |
0.5 |
40 |
| Zn |
Zn Kα |
LoQ–0.69% |
19 ppm |
0.5 |
40 |
| Zr |
Zr Kα |
LoQ–460 ppm |
11 ppm |
0.4 |
40 |
Table 1 displays detected elements in pressed pellets, including concentration ranges, error of estimate, and detection limits. Major lithium ore compounds are highlighted in gray.
(Note: LoD = limit of detection; LoQ = limit of quantification = 3 x LoD; SEE = standard error of estimate; ppm = parts per million.)
Figures 4-6 depict calibration curves from pressed pellet samples. The Y-axis intensity signifies the net peak height (peak intensity minus background intensity).
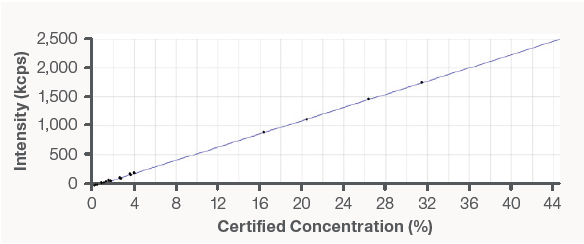
Figure 4. Calibration curve for calcium (Ca Kα₁,₂). Image Credit: Thermo Fisher Scientific - Elemental Analyzers and Phase Analyzers
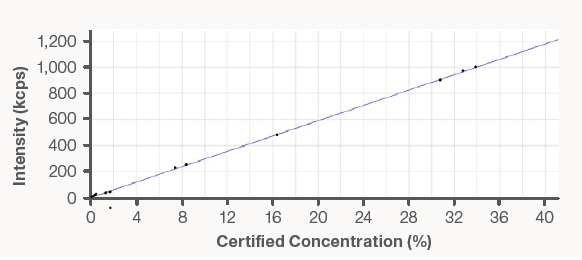
Figure 5. Calibration curve for sulfur (S Kα₁,₂). Image Credit: Thermo Fisher Scientific - Elemental Analyzers and Phase Analyzers
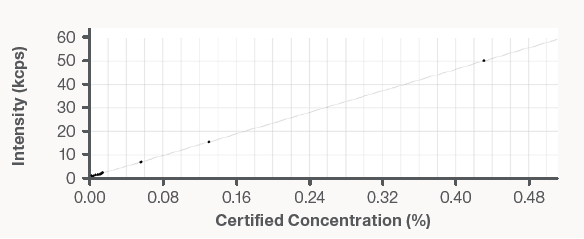
Figure 6. Calibration curve for chromium (Cr Kα₁,₂). Image Credit: Thermo Fisher Scientific - Elemental Analyzers and Phase Analyzers
Conclusions
The ARL PERFORM’X WDXRF Spectrometer, known for its high-performance capabilities, enables quantitative analysis of lithium ores with a customized calibration specifically designed for materials involved in the lithium-salt extraction process.
Interpreting data was made effortless through the use of the advanced OXSAS Software, which is compatible with Microsoft Windows 10. It is worth noting that by incorporating in-process standard samples, all calibration ranges can be extended.
This analysis and calibration approach boasts broad applicability, facilitating comprehensive and adaptable elemental analysis for various material types.
Leveraging the pressed-pellet sample preparation method further enhances the versatility of this approach by offering a fast, easy, and reliable means of examining a wide range of specimens.

This information has been sourced, reviewed and adapted from materials provided by Thermo Fisher Scientific - Elemental Analyzers and Phase Analyzers.
For more information on this source, please visit Thermo Fisher Scientific - Elemental Analyzers and Phase Analyzers.