Many IR and Raman-based applications require the measurement of small particles, often numbering in the hundreds, if not thousands, of particles.
Image Credit: whitehoune/Shutterstock.com
These applications encompass the identification of microplastics and the characterization of various particles, such as environmental aerosols, pharmaceutical nasal sprays, and organic contaminants.
Optical Photothermal Infrared spectroscopy (O-PTIR) performed with mIRage and mIRage-LS instruments can accurately measure and chemically identify particles and microplastics ranging in size from sub-microns to millimeters. This method overcomes the limitations associated with traditional FTIR and Raman techniques.
Detect, Select, Measure, Identify
featurefindIR offers swift, automated detection, spectroscopic measurement, and chemical identification of microplastics and various particles. This capability substantially enhances measurement efficiency and serves as a foundation for assessing a substantial volume of samples across diverse applications.
These applications include, but are not limited to, microplastics, defect contamination, cell analysis, and various other sample types.
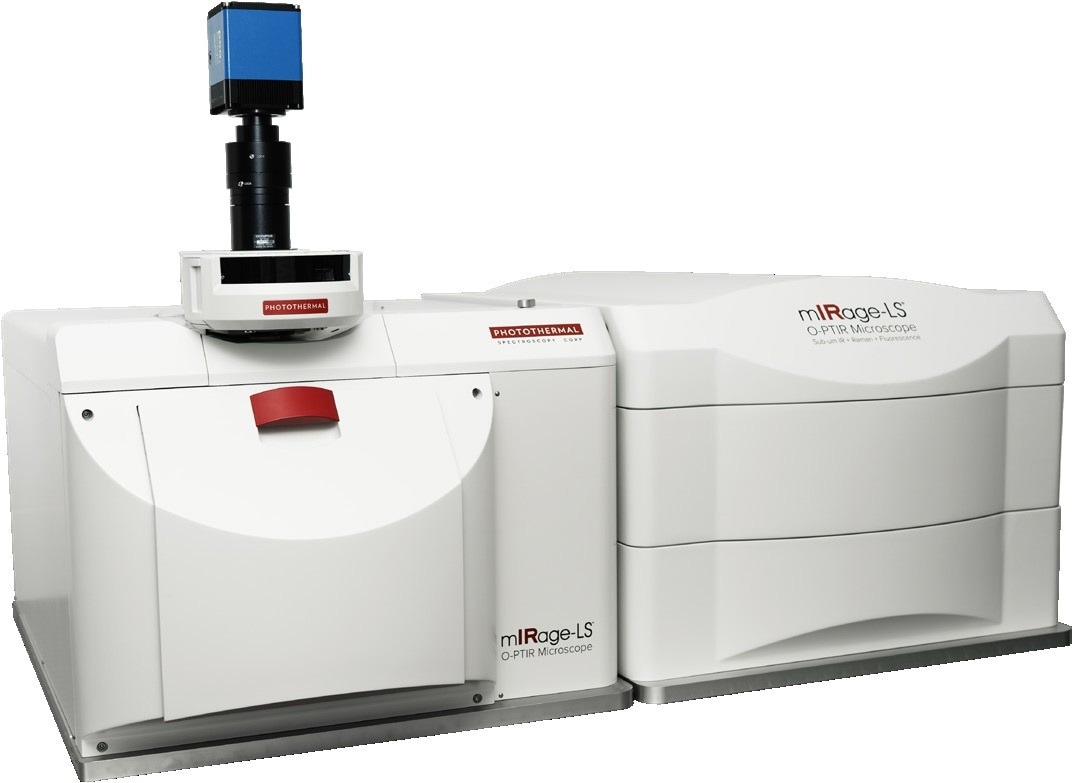
Image Credit: Photothermal
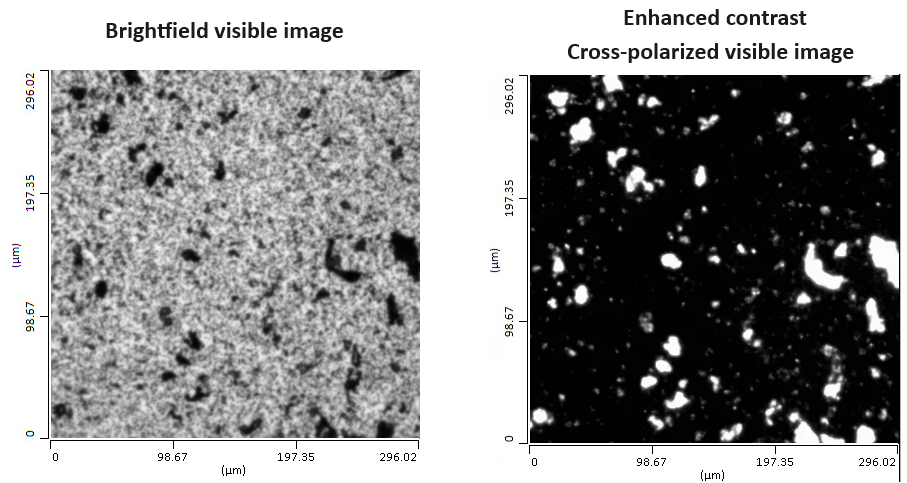
Figure 1. Left, sample and field of view, with regular brightfield imaging, showing reduced particle contrast due to the porous gold coated filter background. Right, microplastics on gold coated polycarbonate filter demonstrating enhanced optical contrast enabling a more sensitive and accurate particle detection. Image Credit: Photothermal
Particle Data Collection Efficiency
Detecting microplastics, particles, and organic contaminants within a larger population of general contaminants can pose challenges. To achieve maximum flexibility, featurefindIR facilitates the use of various image inputs, enhancing accuracy and sensitivity in detection and localization. These inputs encompass:
- Single IR wavelength images.
- The use of a cross polarizer (patent pending) for improved contrast, as seen in Figure 1, for more sensitive and accurate particle detection and location.
- Fluorescence imaging is employed using Nile Red (or similar) stains as input images to assist in locating only polymeric particles, thereby improving throughput by excluding non-polymeric particles that are typically not of interest.
- Autofluorescence images can enhance optical contrast by utilizing the intrinsic fluorescence of the samples, eliminating the need for external dyes.
After capturing the image, featurefindIR offers tools for the precise selection of the necessary particles, as depicted in Figure 2. This selection process takes into account factors such as size, image intensity of the particles of interest, and the option to add or remove particles from the automated selection.
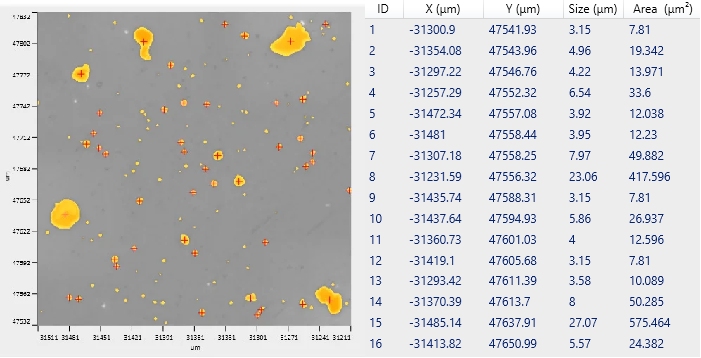
Figure 2. featurefindIR particle map highlights particles based on user selection criteria. Image Credit: Photothermal
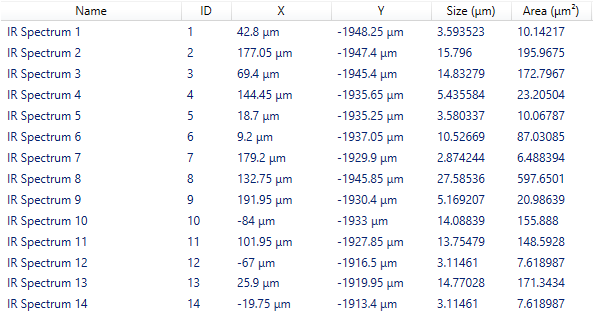
Figure 3. featurefindIR particle Info summary provides dimensional information and location of particles. Image Credit: Photothermal
Automatically Measure and Identify
After determining particle locations and sizes, the mIRage system automatically moves to all measurement locations and conducts rapid, automated IR spectroscopic measurement.
Upon completion of the measurement process, a Particle Info summary table is generated, listing the positions and specific dimensions of each particle where a significant spectrum was obtained.
This table can be seamlessly transferred to the featurefindIR µChemical ID report or exported as a CSV file for further processing in external databases, such as KnowItAll®, as illustrated in Figure 3.
featurefindIR µChemical ID Reporting
The featurefindIR µChemical ID report conducts an automated analysis of all user-selected spectra contained within a PTIR Studio file. It then correlates these spectra with a reference set of spectra integrated into the database. For each measured spectrum, a Hit Quality Index (HQI) is provided as feedback.
If the HQI exceeds a user-defined threshold, the system also reports the best-matched chemical ID. An overlay is displayed, showing the measured and reference spectra, with color coding available to visually assess the quantity of spectra associated with specific plastic types.
Furthermore, quantitative checks can be conducted by selecting each result, revealing a detailed spectrum overlay with the closest OPTIR reference match, as illustrated in Figures 4a and 4b.
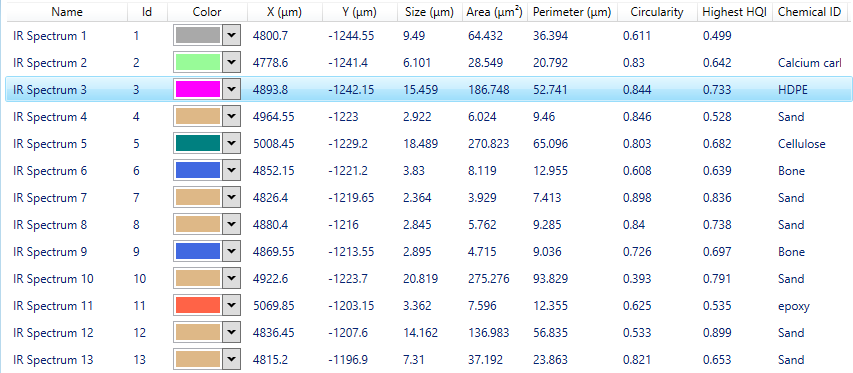
Figure 4a. μChemID database output provides comprehensive analysis of microplastics size and chemical ID. Image Credit: Photothermal
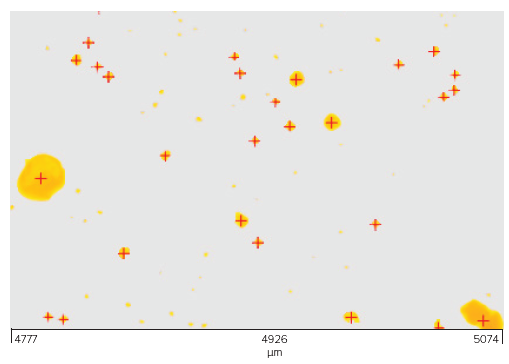
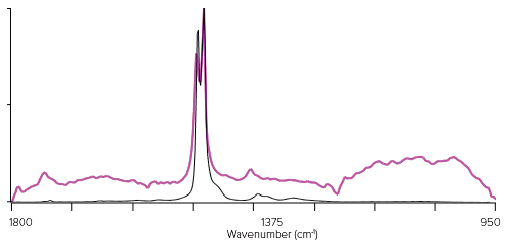
Figure 4b. μChemID database provides measured and reference spectra and particle location. Image Credit: Photothermal
Measurement of Small <30 µm Particles
Representative O-PTIR spectra have been obtained from various polymer particles, encompassing a range of microplastic sizes. These measurements have been primarily focused on the smaller microplastics, specifically those measuring less than 30 µm.
This size range typically exceeds the spatial resolution capabilities of conventional direct IR microscopes like FTIR or QCL.
Figures 5 and 6 illustrate the exceptional sensitivity and spectral profiles for all polymer types. Notably, these figures demonstrate the collection of nearly identical spectra from both 3 µm and 20 µm PMMA particles.
This achievement is beyond the capabilities of traditional IR techniques, which are constrained not only by spatial resolution limitations but also by dispersive scattering artifacts that make them susceptible to discrepancies arising from variations in particle morphology, such as shape and size.
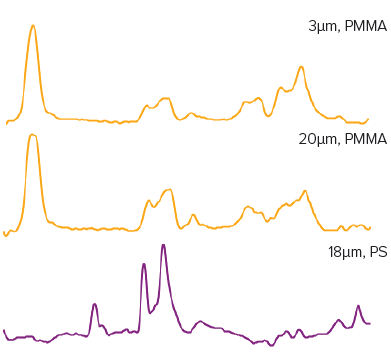
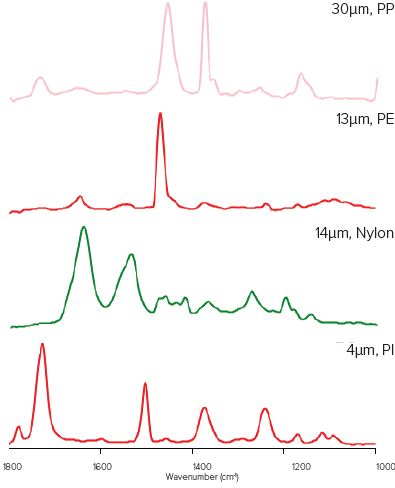
Figure 5. Stacked representative, IR spectra across a wide range of typical microplastics and across a wide range of particle sizes, spanning the challenging <30 μm range. Of note is that even particles of 3 μm and 30 μm from the same material show virtually identical IR spectra. Image Credit: Photothermal
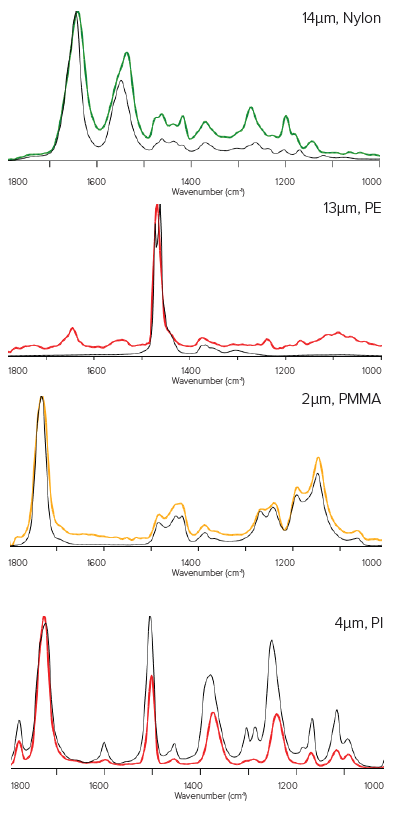
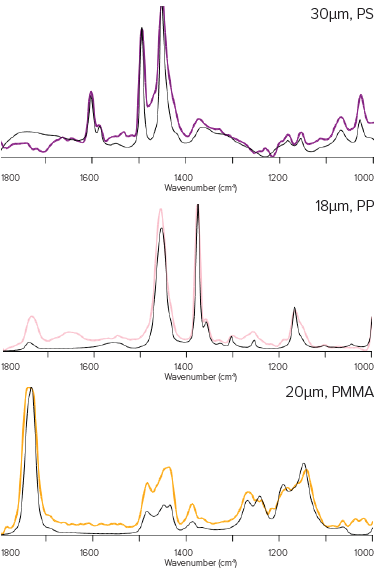
Figure 6. IR spectra overlaid in reference library spectra (black), showing excellent agreement, across all size ranges and plastic types. Image Credit: Photothermal
O-PTIR Spectra Reference Database
The O-PTIR reference spectra database comprises high-quality spectra for the 15 most frequently encountered polymers in microplastic samples. Additionally, it includes reference spectra for various non-plastic environmental particles, such as cellulose, protein, sand, shell, and others.
Users can easily supplement the database with additional reference spectra, either by importing them from existing databases, measuring O-PTIR spectra on known materials, or accessing public domain sources.
Summary
featurefindIR offers researchers an automated and efficient process for swiftly measuring a substantial quantity of relevant microplastics. This process not only provides dimensional data but also identifies its chemical composition through a dedicated µChemical ID database.
All the gathered data can be easily exported in CSV format for further analysis as needed. featurefindIR enhances measurement productivity by offering various methods to identify different types of microplastics, including single-wavelength imaging and fluorescence images.
It is a comprehensive solution for measuring microplastics ranging from submicron to millimeters in size. featurefindIR is available as an upgrade for existing standard mIRage and mIRage-LS systems, with the µChemical ID database offered as an optional feature.

This information has been sourced, reviewed and adapted from materials provided by Photothermal Spectroscopy Corp.
For more information on this source, please visit Photothermal Spectroscopy Corp.