In Raman spectroscopy, the sample undergoes illumination with laser light of a visible or near-infrared (NIR) wavelength. The resulting inelastically scattered Raman signal offers vital information about the vibrational modes of the sample.
When integrated with confocal microscopy, Raman spectroscopy consistently achieves depth and lateral resolutions ranging from a few microns to sub-micron levels.
For transparent composite samples, confocal Raman microscopy emerges as the preferred technology for depth or three-dimensional (3D) profiling, eliminating the necessity for physically sectioning the samples.
Mobile phone touch screens represent technological niches with telecommunication corporations, constituting composite modules that demand superior durability, transmittance, and compactness.
This study investigated the screens of two modern mobile phone models. The Shimadzu AIRsight Fourier transform infrared (FTIR)/Raman microscope proved indispensable for investigating and reverse engineering composite materials.
Instrumentation
The Shimadzu AIRsight combination microscope for FTIR and Raman features 785 nm and 532 nm laser sources for Raman microscopy. A standard 50 x and an optional 100 x objective can be separately installed to deliver varying levels of spatial resolution.
AMsolution software is utilized for data analysis and instrument control. Optional mapping software is employed to obtain depth (line) mapping data.
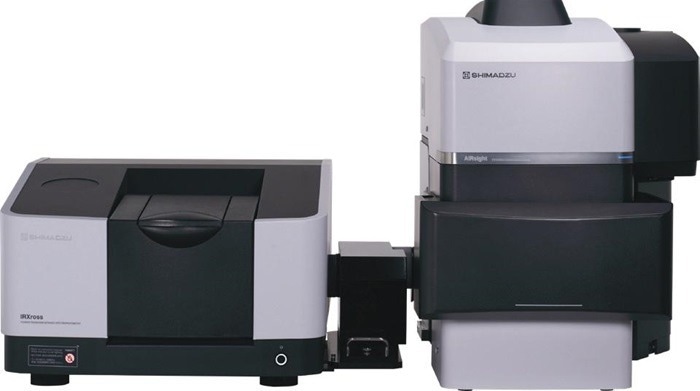
AIRsight Infrared/Raman Microscope. Image Credit: Shimadzu Scientific Instruments
Sample Preparation
The screens of two mobile phone models (4 and 6) were investigated. Model 4 was originally launched in 2010, and Model 6 was launched in 2014. The phone screens were cleaned with isopropanol. The mobile phones were then directly placed on the AIRsight stage to acquire data.
Depth Profile of Model 4 Mobile Phone
High-resolution, wide-field, and tiling images were obtained for a small area on the screen. Depth mapping was conducted along a line passing traversing the red, blue, and green colored LCD elements positioned at the bottom of the screen, with a spacing of 10 μm.
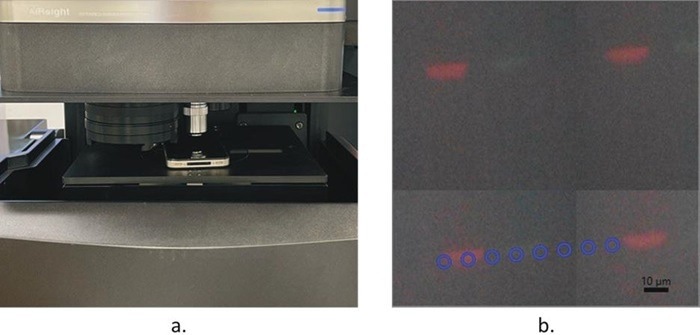
Figure 1. a. Model 4 mobile phone placed on microscope stage ready for Raman depth profiling; b. depth (line) profiling set along a line passing through the colored LCD elements with a length of 70 μm and spacing of 10 μm. Image Credit: Shimadzu Scientific Instruments
Figure 1 depicts the picture of the sample on the stage and the depth (line) configuration. Experimental parameters are detailed in Table 1. Raman spectra were obtained from the top of the screen to the bottom, with a depth of around 1.4 mm and a depth step of 20 μm. Each Raman spectrum was acquired from a 5 μm diameter laser-illuminated area.
Table 1. Experimental Parameters for Model 4 touch screen. Source: Shimadzu Scientific Instruments
| Item |
Parameter |
| Instrument Type |
AIRsight |
| Experiment Type |
Raman Depth (line) Mapping |
| Laser Wavelength (nm) |
532 |
| Objective Lens |
50x objective lens |
| Spectral Range (cm-1) |
100-4000 |
| Number of Scans |
10 |
| Exposure Time (s) |
1 |
| ND Filter |
55% |
| Laser Diameter (μm) |
5 |
| Line Length (μm) |
70 |
| Step Width (μm) |
10 |
| Depth Width (μm) |
1440 |
| Depth Step Width (μm) |
20 |
Numerous layers were visible, aligning with the standard structure of touch screens during the initial era of the mobile industry. The touch screen module commences with a 700 μm glass layer, followed by two ester layers with thicknesses of approximately 120 μm and 100 μm, respectively. An immediate layer, approximately 200 μm thick, separates the two layers.
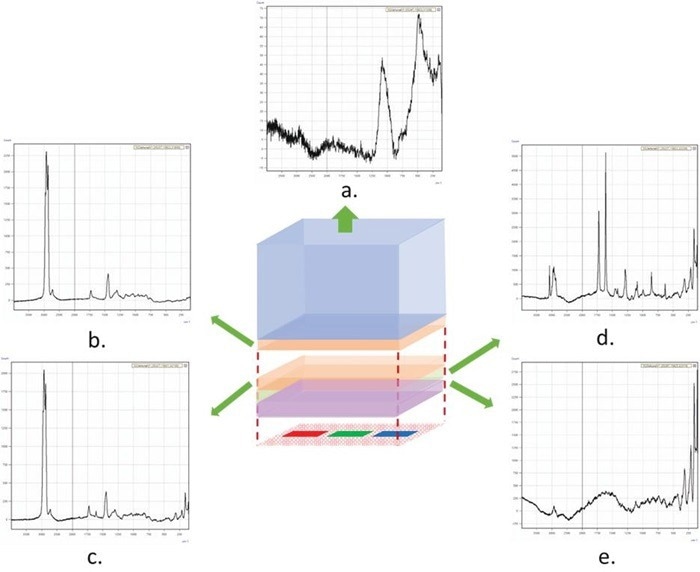
Figure 2. Diagram of the Model 4 touchscreen structure based on Raman measurement and representative Raman spectra of layers. a. Raman spectrum of the glass layer; b. Raman spectrum of the upper ester layer; c. Raman spectrum of the lower ester layer; d. Raman spectrum of the PET film layer; e. Raman spectrum of the unidentified layer. Image Credit: Shimadzu Scientific Instruments
An 80 μm thick PET film layer and a 120 μm thick unidentified layer followed the lower ester layer. Representative spectra of each layer are presented in Figure 2. The Raman database in Wiley’s KnowItAll™ software facilitates the detection of the major components of each layer. The search results are outlined in Table 2.
Table 2. Library search results of each representative Raman spectrum in Figure 2. Source: Shimadzu Scientific Instruments
| Spectrum |
Name |
HQI |
| a |
Sodium Trisilicate |
73.7 |
| b |
Diisooctyl Adipate |
93.6 |
| c |
Isobutyl Hexanoate |
92.5 |
| d |
PET |
76.0 |
| e |
Unidentified |
NA |
Due to the constraints of the Raman database and the complexity of the materials, the detection of each layer may be imperfect and sometimes unattainable. For instance, the spectra of the two ester layers are nearly identical, yet they are identified as two distinct substances.
The ester structures shared by both compounds contribute to the primary features of their Raman spectra. A few peaks below 400 cm-1 were visible in the Raman spectra in the final layer.
The current Raman database failed to provide a suitable match. The low peak frequencies indicated that some inorganic substance might be attributed to it. Within the PET film layer, the peaks below 400 cm-1 were not matched, implying the presence of multiple components in this layer.
The AMsolution software can effortlessly generate chemical images of the mapped area based on peak height, intensity, peak area, or ratios of the aforementioned quantities. Peak height ratio and peak height maps were produced based on distinctive peaks in the Raman spectra of different layers (Figure 3). The boundary and thickness of the various layers can be visualized clearly.
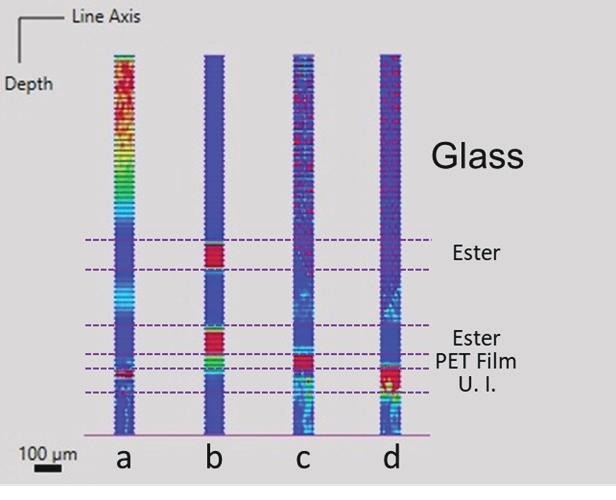
Figure 3. Chemical images help visualize various layers in the mapped area. a. based on peak height ratio of the peaks (847-1241 cm-1) vs. (2789-3056 cm-1); b. based on peak height of the peak (2790-3050 cm-1); c. based on peak height ratio of the peaks (1577-1646 cm-1) vs. (1388-1502 cm-1); d. based on peak height ratio of the peaks (180-275 cm-1) vs. (1219-1370 cm-1). Image Credit: Shimadzu Scientific Instruments
Depth Profile of Model 6 Mobile Phone
The Model 6 mobile phone was launched approximately four years later than the Model 4. Significant innovation in the materials and structure of touch screens has occurred since, which can be observed by the Raman depth profile study.
A Model 6 mobile phone was positioned on the translation stage of the microscope. The 50x objective lens and the 532 nm laser were utilized for Raman spectroscopy. The experimental parameters are outlined in Table 3. Figure 4 shows the experimental setup and depth (line) setting.
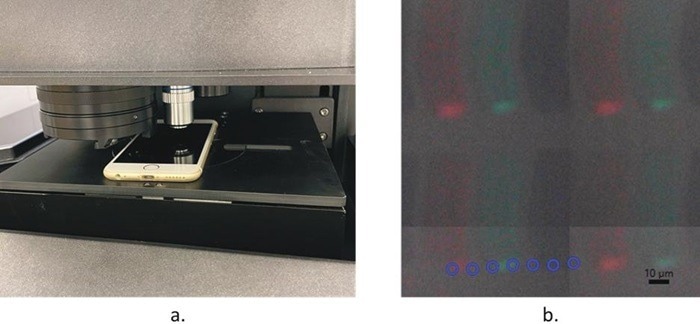
Figure 4. a. Model 6 mobile phone placed on microscope stage ready for Raman depth profiling; b. depth (line) profiling set along a line passing through the colored LCD elements with a length of 60 μm and spacing of 10 μm. Image Credit: Shimadzu Scientific Instruments
Table 3. Experimental Parameters for Model 6 touch screen. Source: Shimadzu Scientific Instruments
| Item |
Parameter |
| Instrument Type |
AIRsight |
| Experiment Type |
Raman Depth (line) Mapping |
| Laser Wavelength (nm) |
532 |
| Objective Lens |
50x objective lens |
| Spectral Range (cm-1) |
100-4000 |
| Number of Scans |
10 |
| Exposure Time (s) |
1 |
| ND Filter |
55% |
| Laser Diameter (μm) |
5 |
| Line Length (μm) |
60 |
| Step Width (μm) |
10 |
| Depth Width (μm) |
775 |
| Depth Step Width (μm) |
15 |
The thickness of the touchscreen decreased from ~1.3 mm in Model 4 to ~0.7 mm in Model 6. The number of layers also decreased.
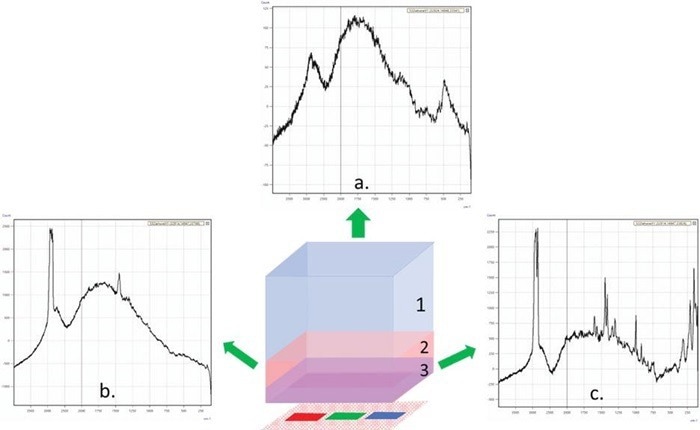
Figure 5. Diagram of Model 6 touch screen structure and representative Raman spectra of layers. a. Raman spectrum of the glass layer; b. Raman spectrum of layer 2; c. Raman spectrum of layer 3. Image Credit: Shimadzu Scientific Instruments
From the Raman spectra, three layers were visible above the LCD-colored elements (shown in Figure 5.) The upper “glass” layer has a thickness of approximately 500 μm, which constitutes over two-thirds of the total thickness.
The Raman spectra of the “glass” layer exhibit a broad envelope containing broad peaks in the high wavenumber region and a narrower peak centered around 490 cm-1. The spectra in this layer appeared different from the glass layer in Model 4, indicating different chemical make-ups. The top layer was followed by a 100 μm thick Layer 2 and a 50 μm thick Layer 3.
In the spectra in Model 4, each layer is displayed as discrete layers with distinctive Raman peaks. In contrast, the spectra of the layers in Model 6 appeared to share common features. For instance, all spectra appeared to have a broad envelope centered around 1750 cm-1.
Layers 2 and 3 exhibited prominent -CH2 asymmetric and symmetric stretching peaks at approximately 2930 and 2860 cm-1. This suggests that the layers in Model 6 were more integrated, possibly featuring numerous components disseminated in a common matrix.
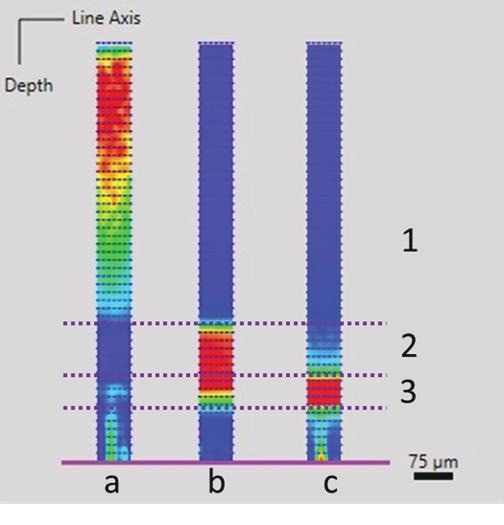
Figure 6. Chemical images of the mapped area. a. based on intensity ratio of 485 cm-1 vs. 1847 cm-1; b. based on peak height of the peak (2786-3037 cm-1); c. based on peak height of the peak (120-180 cm-1). Image Credit: Shimadzu Scientific Instruments
The precise identification of the layers in the touch screen Model 6 proved challenging due to the constraints of the current Raman database and the complex nature of the materials employed. Chemical images of the mapped area are depicted in Figure 6, providing visual insights into the layered structure of the touch screen.
Conclusion
Confocal Raman microscopy enables the non-invasive investigation of transparent composite materials. The confocal microscopic functionality of Shimadzu’s AIRsight facilitates the depth profiling of mobile phone touch screens.
The standard 50x objective lens can achieve a depth resolution of 15 microns. The layered structures observed in the touch screens of two mobile phone models demonstrate the technological advancements in the mobile phone industry.

This information has been sourced, reviewed and adapted from materials provided by Shimadzu Scientific Instruments.
For more information on this source, please visit Shimadzu Scientific Instruments.