Having the capacity to begin analysis at the push of a button is an ideal scenario. The good news is that this is the case with NIR spectroscopy pre-calibrations. Users simply load the sample, close the lid, and push to run the measurement.
This article describes how NIR spectroscopy can be implemented seamlessly into the laboratory without method development. In other words, from day one, instruments will deliver accurate results.
The Advantage of Pre-Calibrations
Optimizing laboratory workflow and integrating a new NIR spectrometer is illustrated in Figure 1.
To create a calibration set, approximately 40–50 samples across the expected parameter range must be measured using a primary method. Using NIR software, the resulting values must be linked to the NIR spectra recorded for the same samples (Figure 1: Step 1).
Subsequently, users must create a prediction model by visually identifying the spectral changes and linking these changes to the values acquired from the primary method (Figure 1: Step 2). After the software has correlated and validated the results, a prediction model will be generated for use in routine measurements.
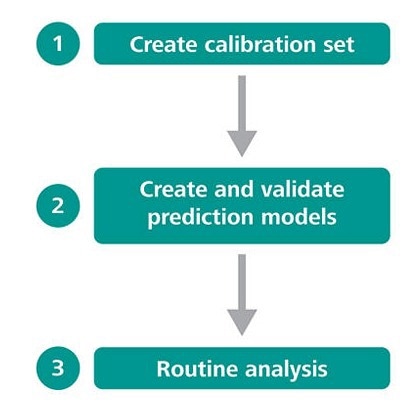
Figure 1. Workflow for NIR method implementation. Image Credit: Metrohm Middle East FZC
The process described above can be time-consuming and laborious as the samples spanning the concentration range need to be acquired and collected. Therefore, being able to bypass steps 1 and 2 is highly beneficial as the NIR instrument would be available for immediate use once installed on the first day.
Pre-calibrations are available for a range of different applications.
What Are Pre-Calibrations?
NIR spectroscopy pre-calibrations are pre-installed prediction models that can be used immediately and deliver reliable results from first use. Users do not need to worry about performing steps 1 & 2, as previously mentioned, as calibration set and prediction model creation are not required.
Pre-calibration models cover an extensive parameter range as they are based on real product spectra ranging between 100–600. Resultingly, the pre-calibration prediction model can be used immediately for routine analysis of unknown samples, as displayed in Figure 2.
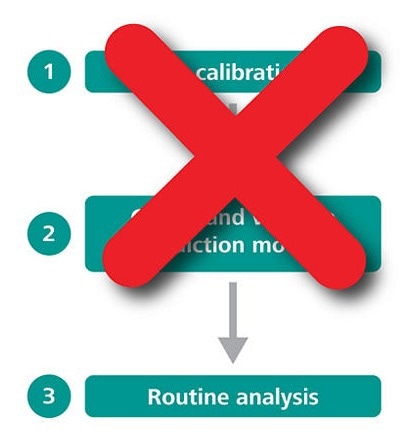
Figure 2. Workflow for NIRS method implementation with a pre-calibration. Image Credit: Metrohm Middle East FZC
How do Pre-Calibrations Work?
Each pre-calibration model, such as Metrohm Vision Air software, is immediately available as a digital file that needs to be imported into the NIR operating system.
- Install the new NIR instrument (including the Vision Air software).
- Enter a method which contains measurement-specific settings, such as measurement temperature and sample vessel type used.
- Import the pre-calibration model and connect it to the method.
The instrument is then set-up and can be used to perform routine measurements and acquire accurate and reliable results. It should be noted that a few control samples of known values should be run through the system to confirm the validity of the pre-calibration model.
Optimizing the Pre-Calibration
Occasionally, the results received when running control samples with the pre-calibration may not be satisfactory. There are a few reasons why this may be the case and three general cases are identified below:
- The results acquired when running control samples slightly deviate from the expected values.
- The results are within an acceptable range, but the standard error causes some concern.
- The results do not correlate at all.
Knowing how to deal with each of these scenarios is detailed below along with some recommendations.
Case 1: The Results Acquired When Running Control Samples Slightly Deviate From the Expected Values
If there is only a slight deviation in values from those obtained from the control samples, a slope-bias correction is the recommended solution. The process is shown in Figure 3.
In the top diagram, the pre-calibration values deviate consistently over the entire range. If this is the case, running a slope-bias correction on the measured model in the Vision Air software should ensure the results correlate as shown in the bottom portion of Figure 3.
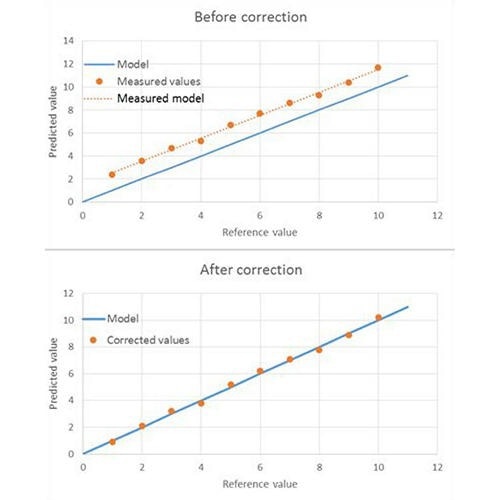
Figure 3. Top: correlation between measured control samples (orange dots) and the pre-calibration prediction model (blue line). Bottom: correlation between the values after slope-bias correction (orange dots) and the pre-calibration prediction model (blue line). Image Credit: Metrohm Middle East FZC
Case 2: The Results Are Within an Acceptable Range, but the Standard Error Causes Some Concern.
In the majority of cases, when this behavior is observed, it is because the range of the pre-calibration exceeds the range that the analyst is interested in by some way.
For example, consider the measurement of a value concentrated at the lower end of the overall range. The pre-calibration error is calculated over the entire range, and therefore the average error (SECV = standard error of cross validation) displays much greater values on the lower end in contrast to those values in the middle of the complete range. This is shown in Figure 4 and Table 1.
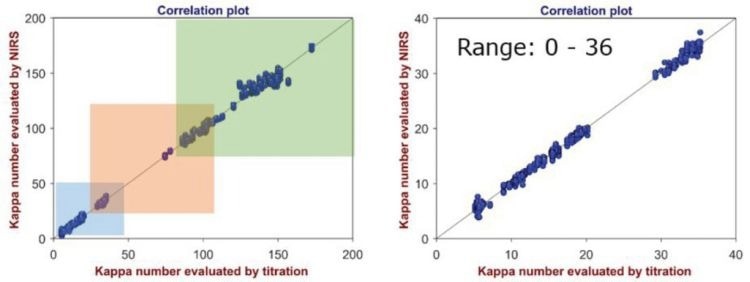
Figure 4. Pre-calibration correlation plot of the kappa number (a wood pulp and paper parameter) over the extended range 0–200 (left), and the smaller range 0–36 (right). Image Credit: Metrohm Middle East FZC
The recommendation to counteract this drift is to remove certain ranges of the pre-calibration, until only the range of interest is left.
Table 1 clearly shows that the SECV for the entire range (0–200) is much greater than the SECV of the smaller range (0–36). By eliminating the samples corresponding to the higher pre-calibration ranges, and leaving only the range of 0–36 in, the resulting modified pre-calibration offers a more acceptable SECV.
Table 1. Figures of merit for the different regions of the pre-calibration from Figure 4. Note the much smaller SECV for the range 0–36 compared to the SECV for the full range of 0–200. Source: Metrohm Middle East FZC
| Range |
R2 |
SEC |
SECV |
| 0–200 |
0.996 |
3.8 |
3.9 |
| 0–36 |
0.994 |
0.77 |
0.81 |
| 32–109 |
0.986 |
3.3 |
3.8 |
| 91–200 |
0.977 |
3.6 |
3.7 |
Case 3: The Results Do Not Correlate at All
There are a number of reasons that cause an unsatisfying prediction performance, but the focus here is on the two most common.
First, the samples being used for analysis may be proprietary. For instance, there are manufacturers that produce unique, patented polyols. Resultingly, proprietary substances are not covered by the standard collection of sample spectra in the pre-calibration and acceptable results are not possible with pre-calibration for proprietary samples.
Another possibility is displayed in Figure 5. It is shown that the values from the primary method (blue data points) and the values from the pre-calibration model deviate significantly.
This is a real world example which was observed by Metrohm staff. Initially, there was some confusion when evaluating the measurement results, but after contacting the customer the reason soon became clear. In this case, the customer had opted for manual titration to measure the primary values (hydroxyl number), and not, as advised, with an automatic titrator from Metrohm.
Therefore, the reason for the deviation is that the control samples were subject to a poor titration method and not because of the quality of the pre-calibration.
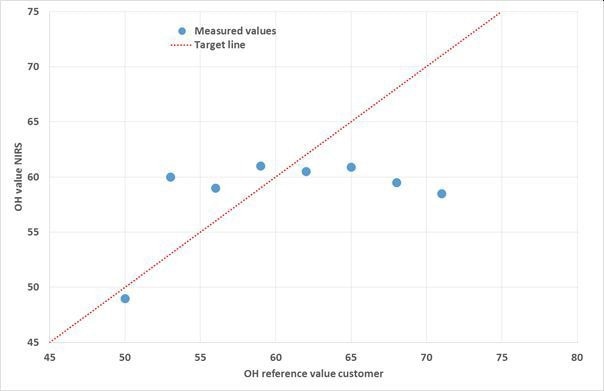
Figure 5. Correlation between measured control samples (blue dots) and the pre-calibration model (dotted red line) for the hydroxyl number in polyols. This data is based on a real customer example. Image Credit: Metrohm Middle East FZC
For additional information regarding manual titration, the article covering the main error sources is below:
(The main error sources in manual titration)
NIR Spectroscopy Pre-Calibrations from Metrohm
Metrohm can provide a diverse range of pre-calibrations for various applications. These are displayed in Table 2, together with the key parameters of the pre-calibration.
Table 2. Overview of available pre-calibrations for the Metrohm Vision Air software. Source: Metrohm Middle East FZC
| Pre-calibration |
Selected Important Parameters |
| Polyols |
Hydroxyl number (ASTM D6342) |
| Gasoline |
RON, MON, anti-knock index, aromatics, benzene, olefins |
| Diesel |
Cetane index, density, flash point |
| Jet Fuel |
Cetane, index, density, aromatics |
| Palm oil |
Iodine value, free fatty acids, moisture |
| Pulp and Paper |
Kappa number, density, strength parameters |
| Polyethylene (PE) |
Density, intrinsic viscosity |
| Polypropylene (PP) |
Melt Flow Rate |
| Polyethylene Terephthalate (PET) |
Intrinsic viscosity, acid number, and others |
| Polyamide (PA 6) |
Intrinsic viscosity, NH2 and COOH end groups |
| Cannabis |
THC, CBD, and CBG content; moisture |
| Stool analysis |
Fat, calorie, and nitrogen content; moisture |
Conclusion
Pre-calibrations allow users to bypass the labor intensive model development process meaning they can use the instrument on day one, saving both time and money. Metrohm’s prediction models are based on a large number of real product spectra.

This information has been sourced, reviewed and adapted from materials provided by Metrohm Middle East FZC.
For more information on this source, please visit Metrohm Middle East FZC.