Moisture and temperature have a significant impact on the mechanical performance of polymers. However, due to the sluggish diffusion process that limits the uptake of moisture in polymers, humidity-dependent mechanical testing often requires months of conditioning to achieve equilibrium.
Near-surface mechanical testing enables large surface-to-volume ratios in the test region. This allows the equilibrium conditions within the test volume to be established in less than an hour and expands the range of test conditions that can be investigated promptly.
Nanoindentation-based humidity tests can, therefore, be employed to quantitatively and efficiently assess polymeric materials' mechanical and dynamic characteristics.
This article describes the humidity-testing process for two nylon samples, including evaluating time to equilibrium and various viscoelastic properties calculated using the lock-in enabled nanoDMA III transducer.
Method
A Hysitron® TI 980 TriboIndenter®, equipped with an xSol® humidity control, nanoDMA® III, and XPM™, was employed to assess the mechanical and dynamic attributes of two commercially accessible nylon samples (nylon 6 and a rigid glass-filled nylon 66) at room temperature under 10%, 50% and 70% relative humidity (RH).
Figure 1 depicts the experimental setup and a representative sample region with topographic and property maps.
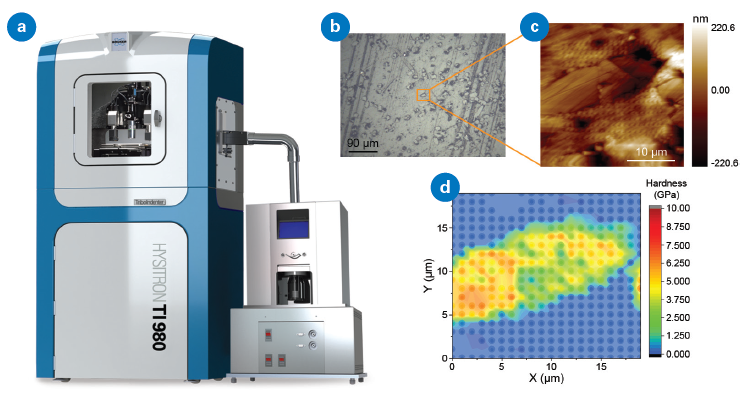
Figure 1. (a) Hysitron TI 980 with humidity setup, (b) optical image of glass-filled nylon at 10% RH, (c) SPM image after XPM test, showing both glass and nylon regions as well as the 400 indents from XPM, and (d) property map of hardness from the area shown in (b). Image Credit: Bruker Nano Surfaces and Metrology
Each sample was made from a 2.54 cm diameter rod machined into a disk with a diameter of 1 cm. The sample surface was polished using standard polishing techniques.
Grids of indents were performed with a Berkovich indenter while concurrently ramping humidity (5 to 10, 10 to 50, and 50 to 70% RH) using PID feedback and a MEMS-based humidity sensor within the micro-environmental sample chamber.
The time to equilibrium was then calculated by comparing the measured properties with the humidity levels measured in the chamber. Using the nanoDMA III reference frequency sweep load function, the tests were conducted at various frequencies (1, 20, 100, and 200 Hz) with a 1200 µN peak load and 3 µm indent spacing,
The maps of the nylon 66 tests were performed using Bruker’s Accelerated Property Mapping (XPM) with a 20 x 20 grid of indents (500 µN peak load and 1 µm indent spacing).
Property maps were generated across nylon and glass fiber regions by measuring the maps after equilibrium for each humidity level. Each grid of 400 indents took only three minutes to complete.
Results
The response time of the storage modulus is less than 20 minutes when the humidity is changed using a step function (Figure 2a). The mechanical properties seem to be unaffected by the small overshoot in the measured humidity.
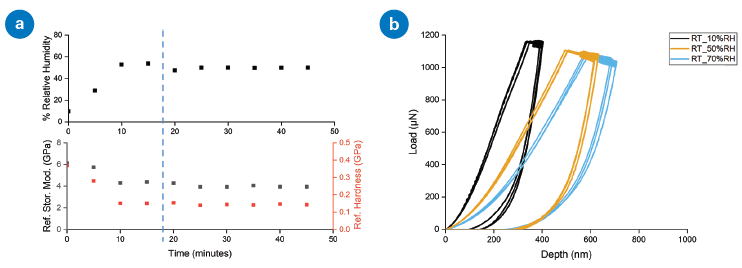
Figure 2. (a) Equilibrium time plot at 20 Hz while RH ramped from 10 to 50%, and (b) load-displacement curves at 10, 50, and 70% RH after 60 min of humidity equilibration. Image Credit: Bruker Nano Surfaces and Metrology
As expected, the load-displacement curves in Figure 2b show a decrease in the unloading stiffness and an increase in the contact depth. This indicates a decrease in hardness and modulus with increasing humidity levels.
The trend of decreasing structural stiffness with rising humidity is supported by the viscoelastic properties (hardness, tan delta, and storage modulus) plotted in Figure 3 and measured using the nanoDMA III reference frequency.
When using scanning probe imaging, a similar observation emerged for the glass-filled nylon sample in regions distant from the glass fibers.
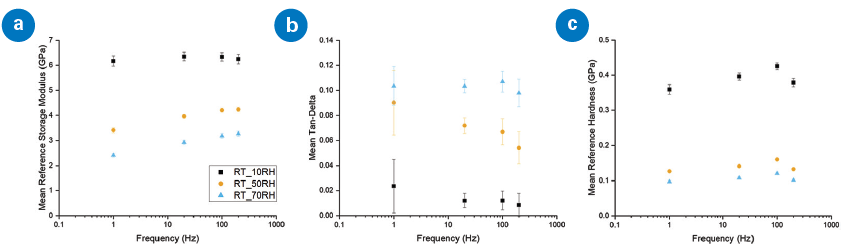
Figure 3. Dynamic (a) storage modulus, (b) tan delta, and (c) hardness from 10 to 70% RH and at reference frequency 220 Hz. Image Credit: Bruker Nano Surfaces and Metrology
Property maps in Figure 4a-c show an interphase region between glass fibers and the surrounding nylon matrix. Using a K-means clustering algorithm from the Tribo iQ™ analysis package, the measured data was separated into three regions: matrix, interphase, and fiber.
XPM modulus measurements of the interphase region indicated a rise in modulus with increasing humidity (Figure 4d), a trend opposite that of the surrounding matrix.
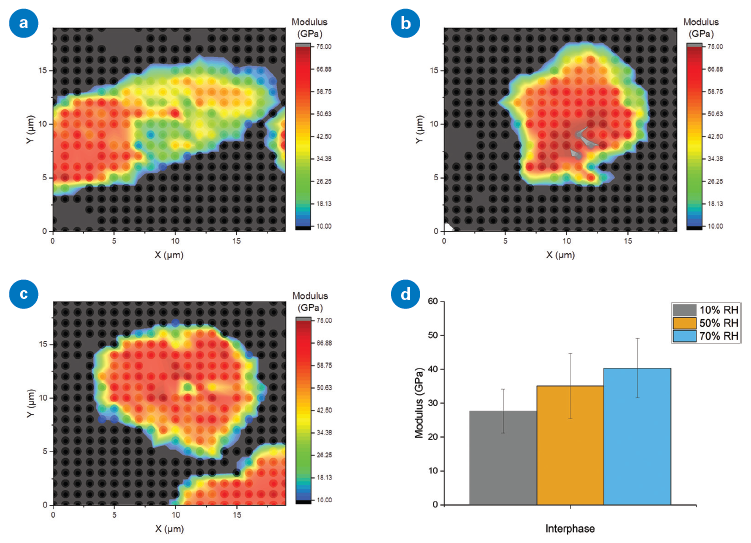
Figure 4. Reduced modulus of glass fibers and the interphase regions surrounding them for different RH: (a) 10%, (b) 50%, and (c) 70%. Increase in (d) storage modulus with increasing RH was seen in the interface region. Image Credit: Bruker Nano Surfaces and Metrology
Conclusions
This system’s ability to control humidity enables the user to achieve the required equilibrium level within a reasonable period (shown here to be less than 20 minutes), even in polymeric materials. Because nylon is hygroscopic, the hardness and storage modulus decreased with increasing humidity.
Clustered data, however, revealed little change in the properties of the interphase region coupled to the glass fibers at different humidity levels.
The combination of Bruker’s humidity control system with nanoDMA III and XPM test methods offers the ideal platform for examining the effects of moisture on the mechanical and dynamic properties of various materials.

This information has been sourced, reviewed and adapted from materials provided by Bruker Nano Surfaces and Metrology.
For more information on this source, please visit Bruker Nano Surfaces and Metrology.