VIBRAPLANE Vibration Isolation Protects the Critical Subsystems of Large Equipment
All complex and intricate assemblies include components with natural frequencies that are critical because they exist in the generalized 8 to 200 Hz environmental spectrum.
This can be demonstrated by the Transmissibility and resonant responses of three components in typical equipment, as shown in Figure 46.1. The resonant responses, or Q’s of these components, go beyond the acceptable level, which is set at Q=1.75 for this example.
The responses of the components are shown in Figure 46.2 after the introduction of isolation at 1 Hz. The roll-off isolator transmissibly reduces the input being fed to each of the three critical components shown. Now, without the need to make any design modification to each component, their respective resonant responses remain below acceptable limit, and no failure will occur.
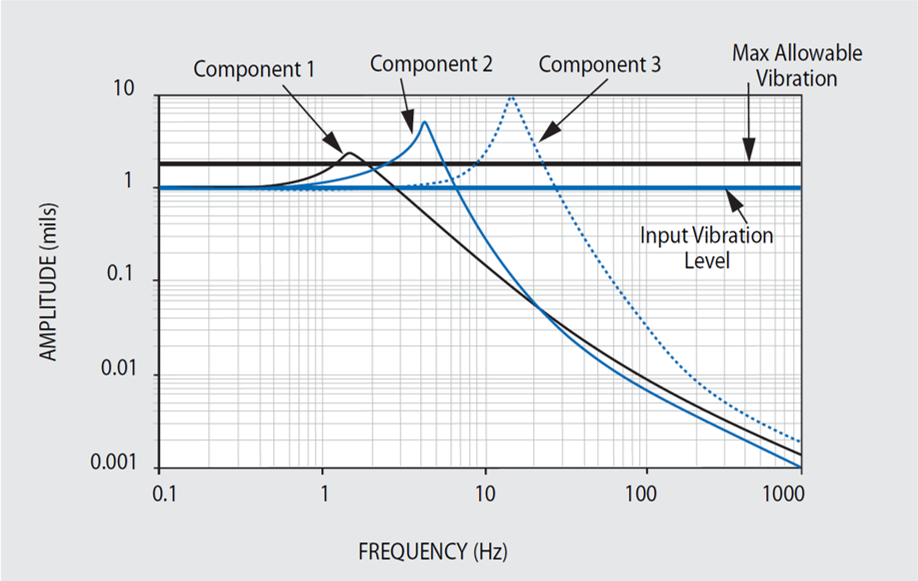
Figure 46.1. Subsystem Response Without Isolation. Image Credit: Kinetic Systems, Inc
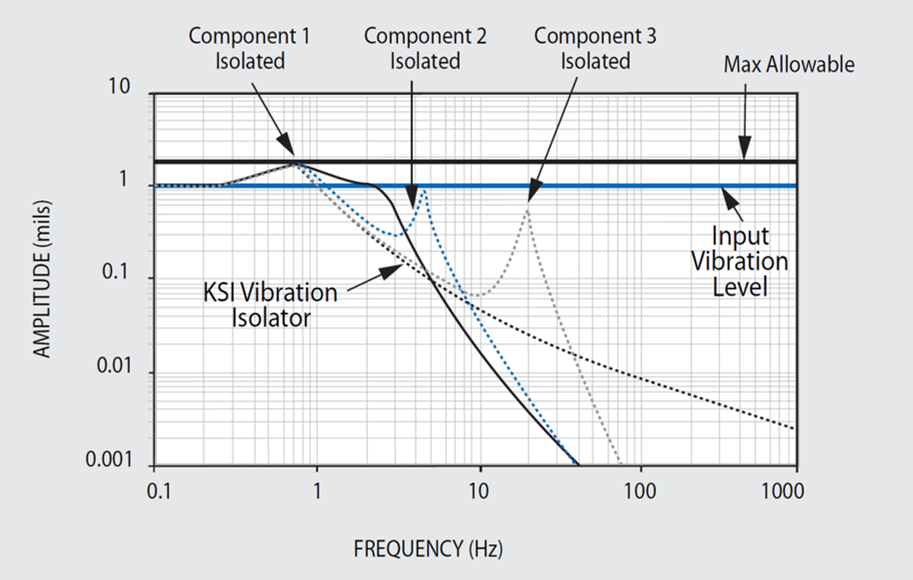
Figure 46.2. Subsystem Response With Isolation. Image Credit: Kinetic Systems, Inc
KSI Optical Tables: Better Built Through Better Design
KSI has removed the guesswork from optical table and vibration control equipment selection. Having developed pre-engineered rigid and high natural frequency honeycomb optical tables, breadboards, and modular rigid supports (which can be upgraded to vibration isolators) KSI offers cost-effective solutions for all vibration environments.
The choice for precision applications in harsh or unknown vibration environments is simple, and KSI recommends high-performance damped honeycomb optical tables, such as its 5300 Series and Active-Air vibration isolation systems. KSI has a range of cost-effective, broadband-damped tables for conventional or moderate environmental conditions, including the 5200 Series or 5100 Series with Isolators or Modular Rigid Supports.
Understanding Optical Table Specifications
Presently, there is a lack of an accepted standard to compare optical tables from different manufacturers. This, in effect, means various manufacturers have a range of unnecessarily complex technical performance specifications.
KSI strives to demystify the selection process and instead highlight the important differences between reality and specification hype. For instance, damping, dynamic compliance, flatness, natural frequency, static deflection, stiffness, and weight are determined by processes using standard instruments and techniques.
However, some manufacturers apply theoretical estimates of intangible performance parameters that cannot be easily verified. For optical table selection and comparison, real measured data and test results are more valuable than theoretical estimates based on unproven hypotheses and idealized assumptions.
Consider the Basics When Selecting and Specifying Optical Tables
With so much technical jargon and excessively complicated static and dynamic deflection concepts being used to market optical tables and vibration isolation equipment, customers and end users may become easily confused impeding the decision making process. Below, KSI clarifies the finer details in a review of the basics so its customers feel confident deciding on which is the right optical table or isolation system for a given application.
Natural Frequency
Optical tables should have a high natural frequency (above 90 Hz) to prevent coincidence with prominent low-frequency sinusoidal building vibrations between 6 and 60 Hz.
KSI, offers one piece tables in commonly requested sizes up to 6 feet (1.83m) by 16 feet (4.88m) with a lowest natural frequency of 90 Hz or better ensure protection from the resonance that building vibrations present.
The relevant parameters are displayed in the natural frequency graph in Figure 47.1. If the (length/width) ratio of the table is equivalent or greater than 1.33, the lowest frequency mode shall be free-free bending; otherwise, the lowest mode will be free-free twisting.
KSI can create larger tables with special tooling for applications requiring bespoke equipment. This can be achieved by joining tables with lower natural frequencies, as shown in Figure 47.1.
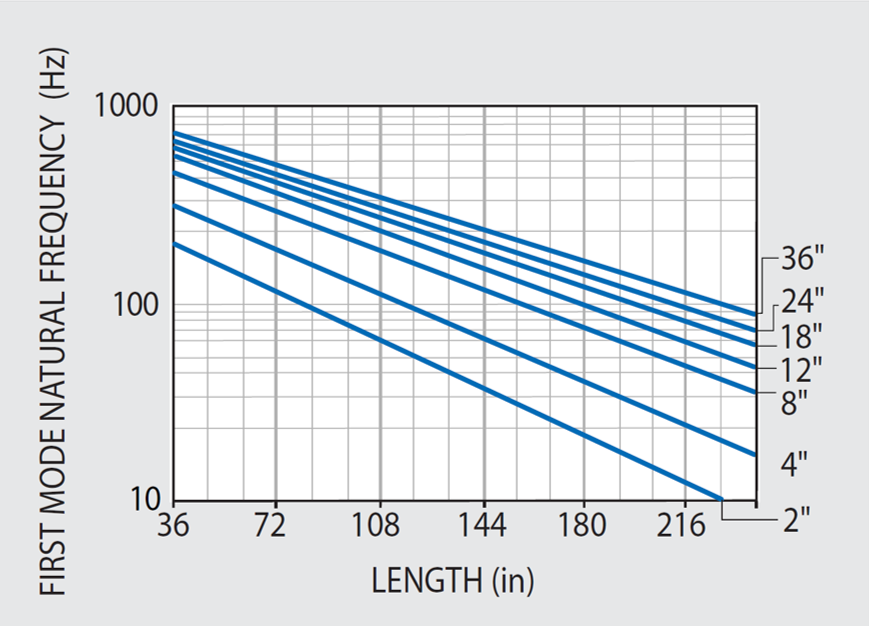
Figure 47.1. Undamped free-free bending mode frequency for KSI standard steel honeycomb optical tables with 3/16" thick top and bottom skins. Frequency is 10% less for tables with 1/8" skins. Apparent resonance of tables with tuned damping is 10% less. Image Credit: Kinetic Systems, Inc
Static Deflection
To minimize relative deflection, or sag, between supports due to their own weight, optical tables should have high rigidity and stiffness. KSI ensures that its tables and breadboards meet these stiffness requirements through proprietary damped rigid epoxy. Moreover, the strength of the epoxy is not compromised by plastic or viscoelastic laminations.
The high stiffness of KSI’s tables can be demonstrated by their high natural frequencies as shown in Figure 47.1. Corresponding small static deflections are shown in Figure 47.2.
The maximum static (1g) deflection of KSI tables in relation to the supports has been tested and agrees with simple beam deflection theory. It should be highlighted that static deflections of the tables are considerably less than their flatness tolerances.
Deflection Due to Equipment Load
Besides minimizing static deflection, KSI’s tables minimizes relative deflection caused by the weight of components and equipment fitted to or resting on the table.
If the assumption is made that any additional equipment installed is distributed across the table uniformly, then the additional table deflection caused by the equipment is calculated by simply multiplying the deflection from Figure 47.2 by the (equipment/table) weight ratio.
When heavy equipment is used, it is advisable to repeat deflection computation with different table lengths and thicknesses until an acceptably low value is achieved; the recommended value is 10% of the precision required by the application.
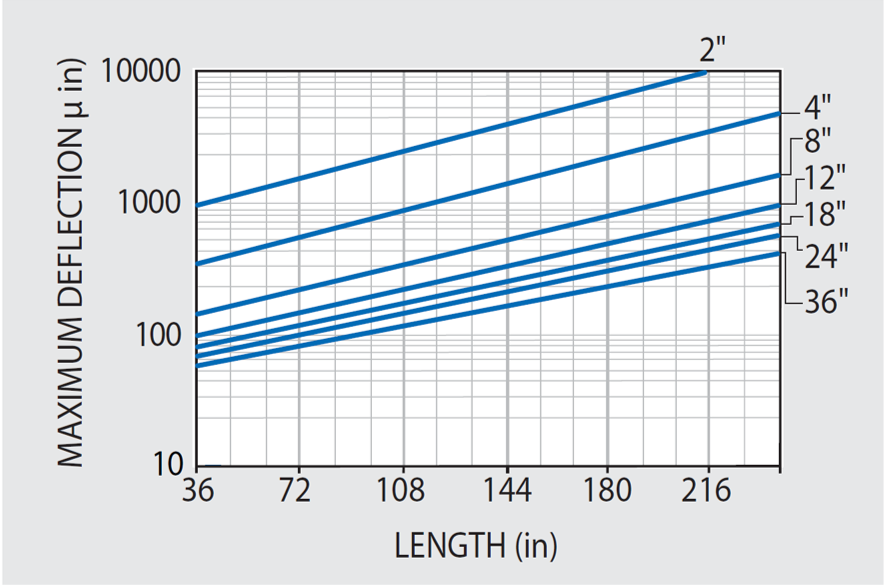
Figure 47.2. Maximum static (1g) deflection due to tables own weight of KSI optical tables relative to supports for 4' wide tables with 3/16" top and bottom skins. Deflection for 3" width is (1.3) and 5' width is (0.8) of plotted values. Multiply by 5.7 to convert from in/lbs to mm/N. Image Credit: Kinetic Systems, Inc
Unit Load Deflection
The factor of relative deflection caused by a one-pound concentrated load centered on the table should be minimal and is shown in Figure 47.3. As evidenced in the table static weight deflection tests, results demonstrate that unit load deflections also closely conform with simple beam deflection theory.
To determine the deflections caused by increased magnitude concentrated loads at the center, multiply the unit load values in Figure 47.3 by the higher load value. For instance, if trying to determine the deflection a 250 lb-load would cause, simply multiply the graph value by 250 for the appropriate table size.
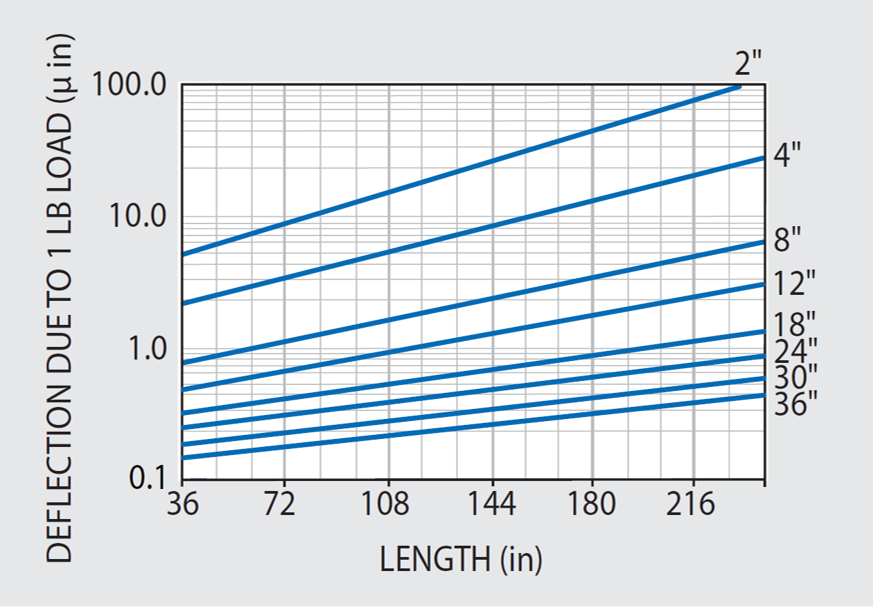
Figure 47.3. Unit load maximum deflections for KSI standard 4' wide optical tables with 3/16" thick top and bottom skins. Multiply by (1.3) for 3' table, and (0.8) for 5' table. Image Credit: Kinetic Systems, Inc
Optical Table Weight
Figure 48.1 shows the approximate weights for 48″ wide 5300 Series tables across different thickness ranges. The weights of other equivalent tables of various width and skin thicknesses may be approximated by multiplying the values in Figure 48.1 by the ratios of (actual width/48″) or (actual skin thickness/ .180″) as necessary.
KSI’s steel honeycomb optical tables are structurally sound and weigh considerably less than a comparable solid steel or granite flat surface plate. However, for optimal stability and resistance to vibratory forces a certain amount of weight is advisable.
The table weight is typically a factor of its thickness and length. Two main principles are: (1) the table should ideally weigh between 2.5 and 5 times more than the mounted equipment; and (2) the table thickness should be between 6% and 10% of the length as a minimum. Using these two maxims should help in defining the minimum weight of a table for a given application. For instance, the recommendation when performing precision applications is that the minimum standard thickness of a 10 in-long table should 8 in or 12 in-thick.
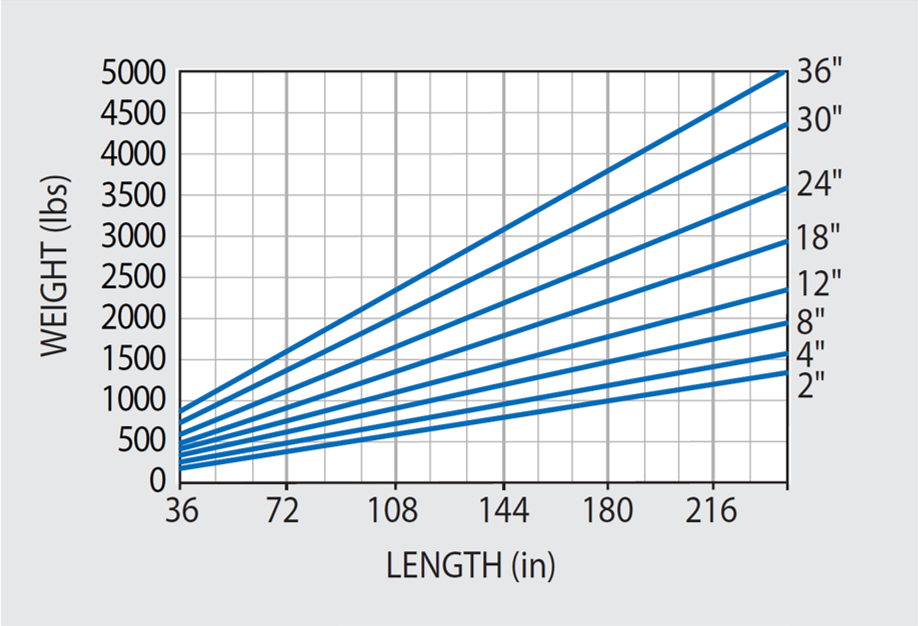
Figure 48.1. Approximate weights of 4' wide tables with 3/16" thick top and bottom skins. Weights of 3' and 5' wide tables are in direct proportion to width. Image Credit: Kinetic Systems, Inc
Static and Dynamic Deflection and Compliance
In optical tables, applications quantifying dynamic deflection in terms of compliance is considered a standard practice. Dynamic deflection simply refers to the deflection response to a unit force. In static or steady state forms, Compliance can be determined as flexibility or the “inverse” stiffness in engineering units of deflection per unit force.
The Unit Load Deflections displayed in Figure 47.3 can be characterized as a graph of Static Compliance values at the center of the tables under investigation. Conversely, Dynamic Compliance refers to the deflection response as a result of unit vibratory force.
Consequently, vibration frequency, table resonance, and internal damping will determine maximum response deflection. The dynamic response at the corner of a table, i.e. Corner Compliance, is regarded as the standard measurement for making specification comparisons.
Damping and Dynamic Compliance
Optical tables should offer appropriate levels of internal structural damping (energy dissipation) to regulate relative deflection resonant response when experiencing random high frequency building vibration. Internal damping also limits modal resonant response to transient disturbances.
The exceptional damping properties in all KSI VIBRAPLANE Optical Tables is verified by the standard Compliance Spectra contained in the technical data with each product.
The Compliance Spectra has the same function as the standard Transmissibility Curves. These determine the response deflection of the system, including resonant amplification, as a function of frequency. A low resonant response should be considered key criteria when evaluating which optical tables is most suited to a particular application.
The resonant Q factor, or maximum transmissibility of the lowest resonance mode for KSI Optical Tables, is configured at the production stage in a range as displayed below:
5300 Series: Q = 2–6
5200 Series: Q = 6–9
5100T Series: Q = 9–13
5100H Series: Q = 13–18
5100 Series: Q = 18–25
The relative Maximum Compliance values for 5300 Series Tables are displayed in Figure 48.
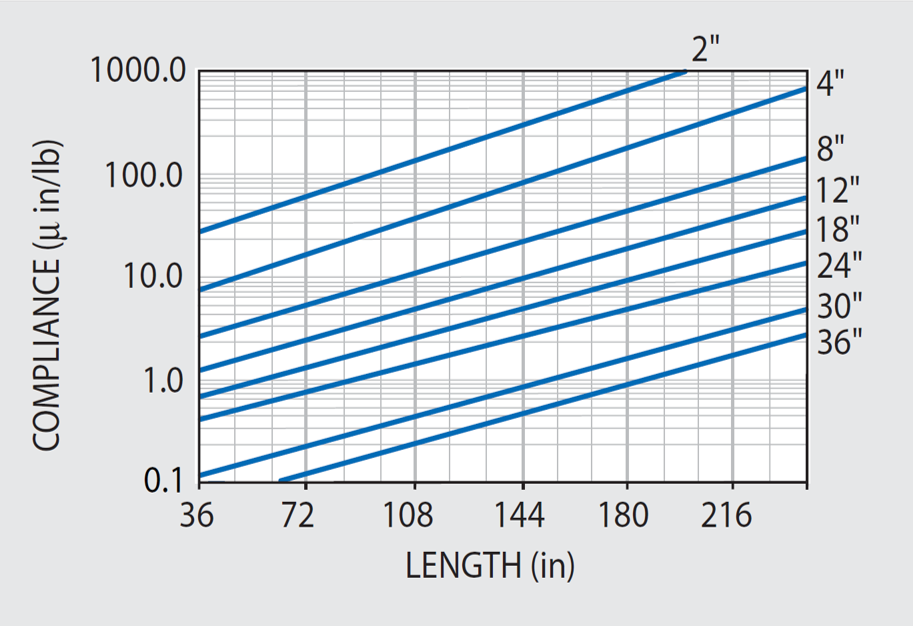
Figure 48.2. Maximum dynamic corner compliance at first resonance for our 5300 Series tables with 3/16" thick skins. Multiply these values by 4 for 5200 Series and 15 for 5100H Series and 5100 Series. Image Credit: Kinetic Systems, Inc
To help demystify the selection of optical tables for a particular application, KSI offers a series of manufacturing specifications alongside real measured and verifiable static and dynamic table properties, such as those displayed in Figures 47.1 to 49.2.
However, for the purpose of making reference and comparison to other manufacturers’ table specifications, KSI can offer the assurance that, regardless of model or price, category, the predicted “Dynamic Deflection Coefficients” and “Maximum Relative Deflection”, responses of KSI honeycomb tabletops are the lowest in the industry.
These values are presented in Figures 49.1 and 49.2 as discussed.
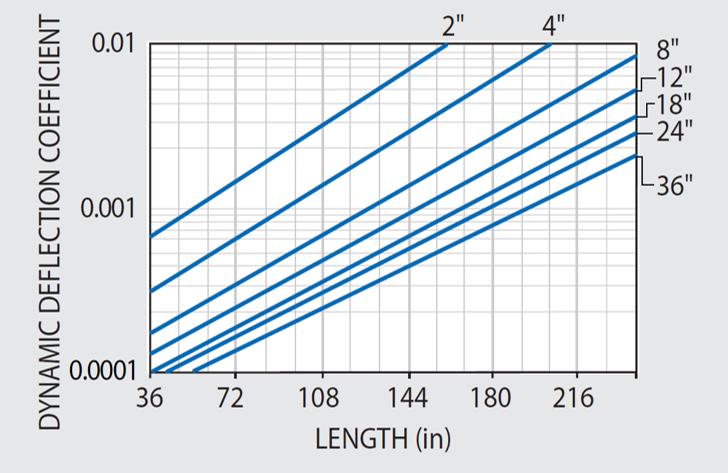
Figure 49.1. Dynamic deflection coefficient DDC for 4' wide 5300 Series. Consult KSI for 5200 Series, and 5100 Series. Image Credit: Kinetic Systems, Inc
Theoretical Considerations in the Optical Table Relative Deflection Response Hypothesis
If it is assumed that the amount of laboratory floor vibration is by nature statistical and random, like white noise for instance, then the rms (root mean square) relative deflection response RD of an idealized rigid lumped mass single degree-of-freedom system can be determined using the following:1
|
RD = (y-x) =
W a Q g 2 / 32 (pie symbol) 3 f n 3 ) 1/2 = 12.25 (W a Q / f n 3 ) 1/2
|
(8) |
Where:
|
(Q / f n 3 ) 1/2 =
(DDC) = Dynamic Deflection Coefficient of tabletop
|
(9) |
Q = Resonant transmissibility of table
W a = Floor Random Vibration Spectral Density,
(g 2 /Hz = floor mean squared vibration acceleration per 1 Hz band)
RD max = (nonisolated) maximum Relative Deflection of tabletop on rigid supports
Common estimations of random floor vibration conditions are:
Light traffic: W a = 10 -10 g 2 /Hz
Heavy Traffic: W a = 10 -9 g 2 /Hz
Light Manufacturing: W a = 10 -8 g 2 /Hz
Heavy Manufacturing: W a = 10 -7 g 2 /Hz
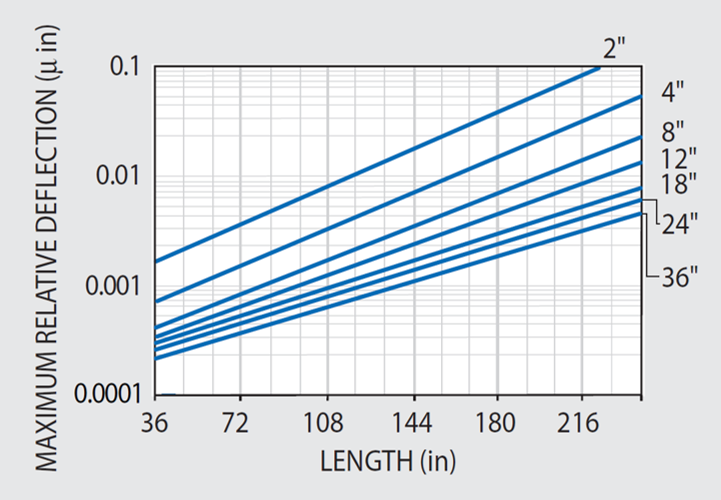
Figure 49.2. Maximum relative deflection (IRDmax) response for 4' wide vibration isolated 5300 Series in light traffic environment with Wa= 10^ -10 g^ 2 Hz. Image Credit: Kinetic Systems, Inc
The Dynamic Deflection Coefficient (DDC) for 5300 Series Tables has been calculated by applying Equation (9) in conjunction with natural frequency and Q data shown in Figures 47.1 and 48.2, and plotted in Figure 49.1 for immediate reference.
When conducting vibration analysis, it can be presumed that an optical tabletop up to its first resonance can be defined as a rigid mass-spring-and-damper single degree-of-freedom system. Resultingly, the single degree-of-freedom Equation (8) can only be applied when evaluating a tabletop without isolation supports.
If isolators are later added, the system will have supplemental deflection coordinates or degrees-of-freedom and Equation (8) is consequently redundant. To resolve this in a simple (quasi-theoretical) manner, two correction factors and a modified interpretation of damping parameter Q can be applied.
The correction factors are:
- Assume isolator transmissibility as T = 1% at high frequency and multiply Equation (8) to effectively eliminate one degree-of-freedom.
- Multiply by 2 for an arbitrary worst case scenario.
- Apply the apparent Q from corner compliance tests to derive Figure 49.2.
The latter Q is referred to as an “apparent” factor because it combines both rotation and translation response motions, rather than one degree-of-freedom as is required in principle.
The consequent equation required for determining Isolated Maximum Relative Deflection (IRD max ) for a vibration isolated tabletop is represented as:
| IRD max = 12.25 (W a Q / f n 3 ) 1/2 x 0.02 |
(10) |
Using Equations (8) and (10) in conjunction with Figure 49.1, the Maximum Relative Deflection of vibration in the isolated 5300 Series tabletops presented in Figure 49.2 for immediate reference.
References
- Crede, C.E. “Failure Resulting From Vibration”, Random Vibration, Volume 2, Edited by S.H. Crandall, MIT Press, 1963

This information has been sourced, reviewed and adapted from materials provided by Kinetic Systems, Inc.
For more information on this source, please visit Kinetic Systems, Inc.