This article explores how ABB OA-ICOS technology can be used to understand the mechanisms of nitrous oxide emission in drylands.

Image Credit: Shutterstock/Sebastian 22
Introduction
Previous research has indicated that soil wetting and drying cycles can trigger significant pulses of nitrogen emissions in the form of nitric oxide (NO) and nitrous oxide (N2O). These emissions arise from biological and abiotic processes, with their intensity varying according to the degree of aridity.
Certain dryland regions have exhibited some of the world's highest NO and N2O emission pulses. Given the anticipated expansion of dryland areas due to climate change, it becomes imperative to comprehend the mechanisms underlying nitrogen emissions in these ecosystems, enabling a better understanding of their impact on climate and air quality.
In the article “Rapid nitrate reduction produces pulsed NO and N2O emissions following wetting of dryland soils”, researchers from the University of California Riverside investigated nitrogen emissions at two dryland sites (desert and chaparral) in Southern California.1 The primary objective of this research was to investigate the factors contributing to NO and N2O emissions in dryland areas following soil wetting with isotopically enriched nitrate and ammonium solutions.
Furthermore, the study aimed to elucidate how nitrogen availability affects the magnitude of these emissions. Various biological and abiotic processes influence these emissions, including nitrification, denitrification, and chemodenitrification. These processes can occur simultaneously, making it challenging to pinpoint their individual contributions to nitrogen emissions.
To address the limitations of conventional static chamber experiments, this study employed isotope tracers and advanced analytical tools, such as the ABB laser-based Off-Axis Integrated Cavity Output Spectroscopy (OA-ICOS) Enhanced Performance QC Benchtop Isotopic Nitrous Oxide Analyzer for precise and high-resolution measurements of N2O and δ15N. Additionally, the study utilized passive samplers to measure the amount fraction of 15N in NO.
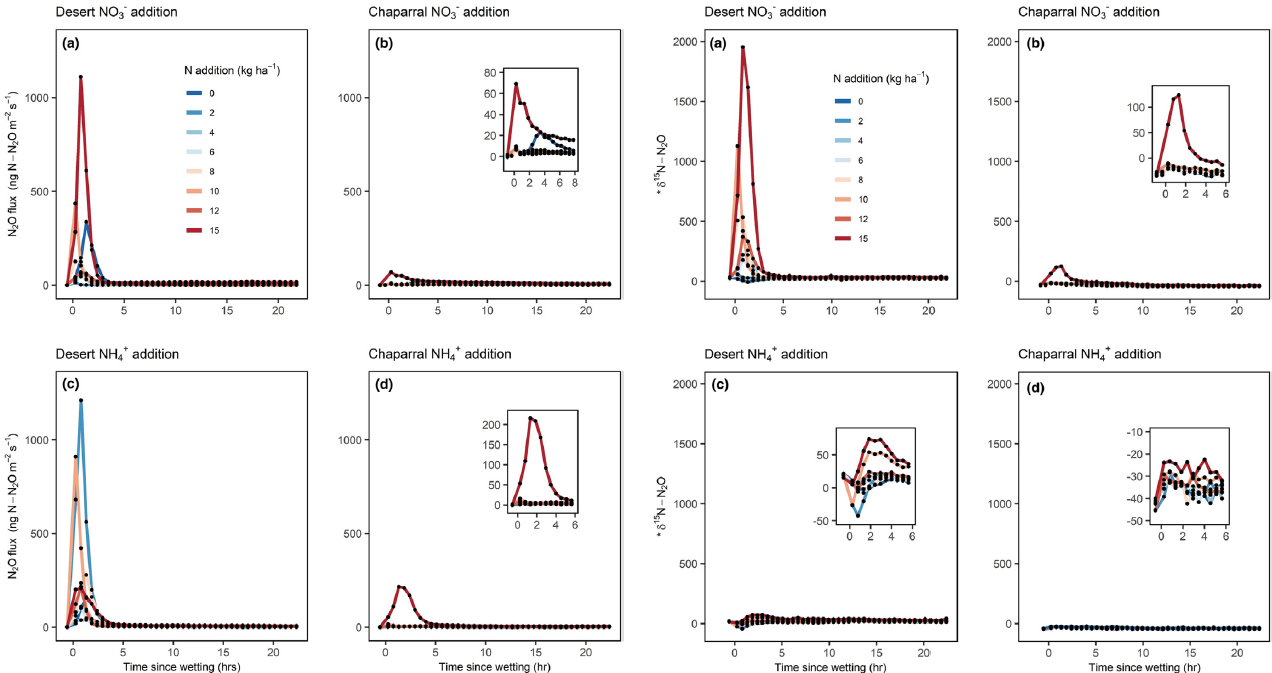
(left): Soil N2O emissions over 24 hours from desert (a,c) and chaparral (b,d). (right): Isotopic composition (δ15N) in N2O in desert (a,c) and chaparral (b,d).
Image Credit: ABB
By pairing high temporal resolution measurements of nitrogen emissions with stable isotopologues, the authors analyzed the relation between increasing nitrogen availability and the amount of NO and N2O released. The authors hypothesized that the emission of nitrogen trace gases from soil is constrained by the availability of soil nitrogen, leading to episodic emissions of NO and N2O emissions proportional to the amount of added nitrogen.
Methods
To understand the various factors contributing to the NO and N2O emissions, the authors introduced 15N-labeled NO3− or NH4+ solutions into the dry soils. They utilized an automated chamber system connected to an NO analyzer (based on UV measurement of the depletion of ozone titrated by NO) and to a laser-based ABB Enhanced Performance QC Benchtop Isotopic Nitrous Oxide Analyzer (GLA451-N2OI2). Additionally, the researchers also quantified NH3 emissions using passive samplers as a relative index of the amount of NH3 in soil spore space, which could be accessible to nitrifying organisms.
ABB OA-ICOS Enhanced Performance QC Benchtop Isotopic Nitrous Oxide Analyzer.
Image Credit: ABB
Moreover, the authors developed the following hypotheses that were tested with respect to the expected observations as a function of the origin of pulsed nitrogen emissions:
- Nitrification → Added 15N–NH4+ should be captured as NO and/or N2O.
- Denitrification → Added 15N–NO3− should be captured as NO and/or N2O.
- Rapid transformation of accumulated nitrification intermediates (e.g., NO2−) → Zero 15N should be found in NO or N2O emissions.
The research measured N trace gas emissions beneath eight chamise shrubs within the chaparral and eight creosote shrubs in the desert. For each group of shrubs, two pairs of PVC collars were installed. One pair was treated with NO3− solution, and the other with NH4+ solution. One collar measured N emissions in each pair, while the other monitored soil conditions (including temperature, moisture, and inorganic N levels) to minimize interference with emission measurements.
Subsequently, the soil inside the collars was wetted with 500 mL of deionized water, simulating approximately seven millimeters of rainfall, frequently observed in the region.
Eight nitrogen levels were introduced during the wetting, corresponding to 0, 2, 4, 6, 8, 10, 12, or 15 kg-N ha−1 as either NO3− or NH4+, mirroring a spectrum of annual nitrogen deposits in Southern California drylands. The nitrogen added was isotopically enriched to 2 atom percent 15N.
NO and N2O emissions were recorded every 30 minutes for 24 hours after wetting the soils. NO and N2O fluxes were calculated as the linear change in trace gas concentrations inside the chamber headspace over the last 90 seconds of the two-minute incubation. The UV-based NO analyzer was recorded every 10 seconds, and the LGR analyzer recorded N2O spectra every 18.5 milliseconds; thus, the addition of 54 such spectra gave a fraction of the 1-second average. Furthermore, the isotopic ratio measurement capability of the laser-based LGR instrument was used to report [15N] in N2O values as a tracer for the incorporation of 15N tracer into N2O after wetting dry soils.
Results
Large N2O emission pulses were observed within minutes after wetting. However, rapid reduction of NO3 − produced pulsed N2O emissions at both sites within 15 minutes of adding water. This was unexpected as denitrification is an anaerobic process and not thought to dominate in well-aerated coarse-textured soils during dry summer months.
This was possibly due to the rapid onset of microbial respiration consumed sufficient O2 to stimulate N2O production via denitrification immediately after adding water, or soil aggregates may have sustained a viable denitrifier population within anoxic microsites throughout the hot and dry summer. They also observed that the N2O emissions were insensitive to the experimentally added nitrogen as the N2O pulse magnitude did not increase in proportion to the amount of ammonium or nitrate added.
In contrast to N2O, NO emissions lasted for 24 hours in both types of soils and were governed by nitrogen limitation of multiple N cycling processes, suggesting that N-limited NO production pathways could increase in response to higher rates of atmospheric nitrogen deposition.
This work demonstrates that nitrate can be rapidly reduced within minutes of wetting summer-dry desert soils, producing significant N2O emission pulses and that multiple processes contribute to prolonged NO emissions. These wetting-induced nitrogen trace gas production pathways are widespread across ecosystems experiencing repeated drying–wetting cycles and are likely to become increasingly important sources of atmospheric NO and N2O as global precipitation regimes become more variable. These mechanisms represent significant pathways of ecosystem nitrogen loss, contributing to regional air quality and global climate dynamics.
References and Further Reading
- Krichels, A.H., et al. (2022) Rapid nitrate reduction produces pulsed NO and N2O emissions following wetting of dryland soils. Biogeochemistry. https://doi.org/10.1007/s10533-022-00896-x

This information has been sourced, reviewed and adapted from materials provided by ABB.
For more information on this source, please visit ABB.