This article looks at the measures that can be taken to avoid hindrances caused by unwanted contaminants when measuring size distributions using laser diffraction.
The solution lies in employing Size Sure, a software feature available on the Mastersizer 3000+ that reliably differentiates between steady-state and transient signals. By utilizing Size Sure, users can gain a deeper understanding of their sample, enhance confidence in routine measurements, and ensure accurate method development from the outset.
The Challenge of Real-World Samples
In an ideal scenario, particle dispersions for laser diffraction size analysis would be immaculately clean, ensuring a smooth analytical process resulting in particle size distributions (PSDs) accurately representing the true sample.
However, real-world analyses seldom unfold so seamlessly. Many of us have experienced the frustration of encountering bubbles or aggregates in dispersion liquids midway through sample preparation or analysis. Additionally, if the particles under study tend to adhere to the dispersion accessory walls or other surfaces, cross-contamination between samples can occur, even when you are carefully following cleaning protocols.
These undesired particles, often referred to as ‘transients, alter the diffraction pattern generated at that moment, leading to potentially misleading PSDs. In routine measurements, this can compromise reproducibility and cast doubts on the quality of the source material. Moreover, if encountered during the early stages of method development, it can derail the optimization process, consuming valuable time and complicating matters.
Help is at hand thanks to the Size Sure feature, which is now available with the Mastersizer 3000+ from Malvern Panalytical.
About the Mastersizer 3000+
Since its launch in 2012, the Mastersizer 3000 laser diffraction system has garnered a reputation for being a compact, versatile, and high-performance instrument for acquiring particle size distributions.
Its applications span a wide range, from assessing powder flowability and packing to understanding drug dissolution rates, monitoring food emulsion stability, and ensuring the optical performance of paints. As a result, the Mastersizer 3000 has emerged as an invaluable asset across research and development (R&D) and manufacturing sectors.
This success owes much to both the hardware and software components. Over the years, alongside numerous features and accessories, Malvern Panalytical has released two software modules benefiting all Malvern instruments: Smart Manager, optimizing uptime and usage, and OmniTrust, ensuring regulatory compliance and data integrity.
Continuing this legacy, the Mastersizer 3000+, launched in March 2024, introduces three added software features to enhance particle-sizing capabilities and inform your critical decision-making:
- Size Sure for improved confidence in routine measurements and method development
- Data Quality Guidance for helping users make independent decisions on real-world samples
- SOP Architect for standardized, streamlined method development
When coupled with the instrument’s flexibility and ease of use, the Mastersizer 3000+ emerges as the ultimate solution for particle sizing needs.
Size Sure on the Mastersizer 3000+
Exclusive to Malvern Panalytical, the Size Sure measurement mode is a distinctive feature solely accessible on the Mastersizer 3000+. It employs an efficient patent-pending machine-learning technique called Adaptive Diffraction, which categorizes data into two distinct states, each reported separately:
- Steady-state data describes the particles that are observed most of the time
- Transient-state data describes events – whether from particles or other sources – that are only observed occasionally, typically less than 10% of the time.
Activating the measurement mode involves selecting the ‘Size Sure’ option in the software, generating two PSDs in the final report (Figure 1). Consequently, the steady-state data is inherently more representative of the true sample, instilling greater confidence in the obtained results. Simultaneously, the separate reporting of transient-state data enables a deeper understanding of the dataset and facilitates proactive measures to minimize such interferences in subsequent analyses.
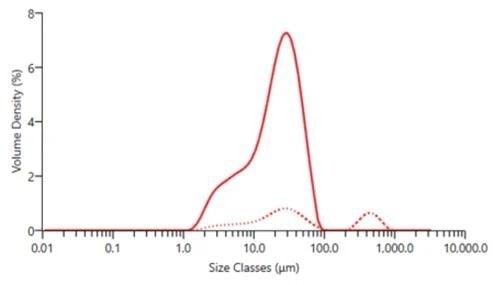
Figure 1. Particle size distribution for an ibuprofen suspension measured in the presence of interfering transient scattering events using Size Sure, showing the steady-state (solid line) and transient-state (dotted line). Image Credit: Malvern Panalytical Ltd
Importantly, Size Sure does not function as a data filter; instead, it creates two PSDs where previously only one was available. These PSDs are produced by essentially 'splitting' the original data, allowing users to sum them using the 'Extract Classic Result' function to obtain the classic PSD. However, it is worth noting that while Size Sure can assist in mitigating the impact of transients, Malvern Panalytical does not advise using it to compromise on sample cleanliness standards.
How Does Adaptive Diffraction Work?
Within the Adaptive Diffraction algorithm, the raw diffraction data is combined into segments on a millisecond timescale. These segments are categorized as either ‘steady-state’ or ‘transient-state’. Subsequently, the segments within each class are averaged across the entire measurement length before being subjected to Mie theory or Fraunhofer theory to turn them into a PSD.
The Adaptive Diffraction classification employs machine-learning algorithms to adjust processing parameters throughout the measurement process. These algorithms are not memory-intensive, meaning they will run quickly and reliably on the same computer used for instrument control. Extensive validation conducted on 1 TB of diffraction data also assures the reliability of the results.
Key Applications of Size Sure
Size Sure offers advantages across various sample types, proving especially beneficial in settings prone to dispersant contamination and where maintaining pristine lab conditions is difficult.
Industries such as ore extraction, cement production, or large-scale polymer processing often face these challenges. Moreover, it proves valuable in cross-contamination scenarios with previous samples, particularly when particles adhere to cell walls.
To illustrate Size Sure’s efficacy in managing such circumstances, Figure 2 demonstrates its capability to distinguish between latex particles and a very small quantity of larger glass beads acting as contaminants.
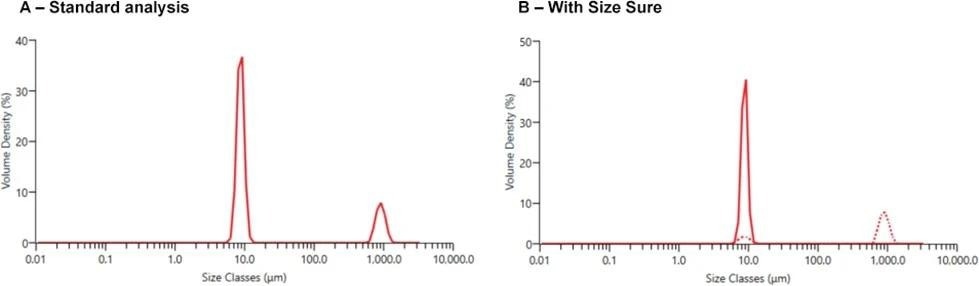
Figure 2. Particle size distributions obtained for an 8.9 µm latex sample spiked with three 1 mm glass beads, representing a coarse particle contaminant: (A) Standard analysis, showing an apparently bimodal distribution as a result of the presence of the contaminant; (B) Analysis using Size Sure, showing the separation of the contaminant as the transient state (dotted line), enhancing confidence in the distribution of the latex particles as the steady state (solid line). Note: In plot B, the reason for a small portion of the 8.9 µm band being identified as ‘transient’ is that any data segment generated from a part of the sample containing a transient particle will also contain regular particles, making it impossible to completely separate out the two signals. Image Credit: Malvern Panalytical Ltd
Size Sure is beneficial when bubbles arise within sample dispersion, a scenario frequently encountered when utilizing surfactants to facilitate dispersion. Figure 3 illustrates how Size Sure can detect such artifacts, employing sparkling water as the dispersant to simulate bubble formation within a sample of glass beads.
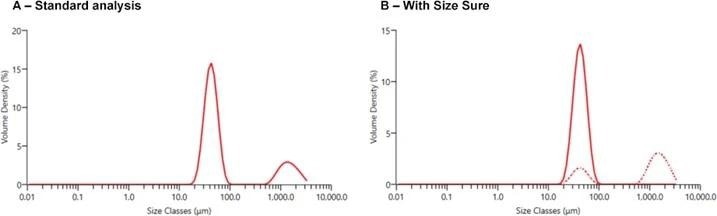
Figure 3. Particle size distributions obtained for a sample of glass beads with a Dv50 of 42 µm, using sparkling water as the dispersant to mimic a source of bubbles: (A) Standard analysis, showing the main mode from the glass beads on the left, but with an additional peak to the right caused by the presence of bubbles in the measurement; (B) Analysis using Size Sure, showing separation of the bubbles into the transient state (dotted line), enhancing confidence in measurement of the glass beads as the steady state (solid line). Image Credit: Malvern Panalytical Ltd
Irrespective of the origin of transient signals in your analysis, Size Sure offers the most significant benefits in the following scenarios:
- During routine analysis, the aim is to maximize the reproducibility of your results and not have your confidence in the data unnecessarily impacted by a rogue coarse particle or bubble.
- At the beginning of method development (or during early-stage screening studies), it is essential to know whether an unexpected mode in the PSD is part of the true particle distribution or whether it simply reflects the presence of a rogue coarse particle or bubble.
Depending on a user’s priorities, upon Size Sure's identification of a transient, they may opt to scrutinize it further, possibly utilizing tools like the Hydro Insight dynamic imaging accessory for the Mastersizer, as depicted in Figure 4.
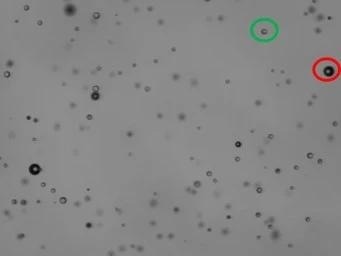
Figure 4. Example Hydro Insight image showing glass beads (example circled in green) and bubbles (example circled in red). Image Credit: Malvern Panalytical Ltd
Alternatively, if users are carrying out method development, they might simply want to press ahead with further work, for example, using the SOP Architect module on Mastersizer 3000+, safe in the knowledge that their initial conclusions are on a firm footing.
Size Sure is also compatible with the Data Quality Guidance software module provided on the Mastersizer 3000+. This module is designed to identify various typical data quality issues and promptly provide feedback, particularly beneficial for users developing their laser diffraction expertise.
Conclusion
By individually documenting data collected during the presence of 'transient' particles like dust, bubbles, and aggregates, Size Sure:
- Provides users with greater confidence in their steady-state size distributions during routine analysis
- Allows them to streamline early-stage method development
- Assists users in understanding the nature of any transients
- Avoids having tight analytical schedules derailed by contaminants

This information has been sourced, reviewed and adapted from materials provided by Malvern Panalytical Ltd.
For more information on this source, please visit Malvern Panalytical Ltd.