|
The 319 series is one of the most widely used aluminum alloys in the automotive industry. This alloy presents silicon contents from 5.5 to 6.5 and copper in the range from 3.0 to 4.0 (in wt.%) [1, 2]. The principal hardening constituent for the 319 alloy is Al2Cu (θ), and when magnesium is added the ageing process is particularly suitable due to the formation of Mg2Si, an important strengthening precipitate. Ouellet et al. [1] reported a hardening peak for an Al-Si-Cu-Mg alloy occurring by cooperative precipitation of θ and Mg2Si particles. The cast structure for the 319 alloy includes α-Al, Si eutectic particles, Mg2Si, θ, Al5Cu2Mg8Si6 (Q) and other complex intermetallics [3]. Q phase has a high Mg content and is highly insoluble in the α-Al matrix even after a solution heat treatment. That is why Q phase formation must be avoided or at least minimized. By applying a rapid solidification process (RSP) it is possible to obtain a supersaturated solid solution with a higher quantity of alloying elements, and to avoid or minimize the formation of second phases. Parts produced by this method could be applied in some engine parts like the cylinder sleeve, the piston valve retainer and monoblocks [4]. Rapid solidification processes with cooling rates higher than 103 Ks-1 allow a reduction in grain sizes, extended solid solution ranges, reduced levels of segregation and in some cases the formation of metastable crystalline and amorphous phases [5, 6], depending on the solidification rate. For the melt spun technique the effect of the speed on structure and chemical properties has been extensively studied [9] for aluminum alloys. There is a report of previous work on the characterization of Al-Si-Cu alloys [7] obtained by RSP using only one rotation speed. However, the effects of RSP on structure when Mg is added and the rotation speed is modified are not reported for the 319 aluminum alloy. Beyond the analysis of second phase formation it is important to analyze the possible nanostructures formed in the α-Al matrix, the most important characteristic for the alloys produced by RSP. The first objective of this work was to fill the lack of information on microstructure characterization for Al-Si-Cu-Mg melt spun alloys. The effect of Mg content and rotation speed on nanostructure and microhardness were also studied. These aspects have not been reported in the literature for melt-spun Al-Si-Cu-Mg alloys.
Experimental
A 356 alloy ingot, with Al-8.5Si-0.3Mg (wt.%) was used as a master alloy. Pure Cu (powder, >99.99% purity) and Mg (ingot, >99.95% purity) were used as raw materials together with the master alloy to produce alloys with three different Mg contents. Casting was carried out in an induction furnace under a controlled Ar atmosphere into a graphite crucible. Ingots were then remelted in a quartz tube and ejected through a 0.5 mm in diameter aperture onto the surface of a polished copper wheel with a diameter of 200 mm. The experiments were carried out under a He atmosphere in order to avoid melt oxidation. The distance between the crucible orifice and the wheel was 7 mm. The ribbons were produced with copper wheel tangential speeds of 30 and 45 ms−1. The thickness of the ribbons produced by melt spinning was between 30-50 and 20–40 μm, at rotation speeds of 30 and 45 ms−1 respectively. This result agrees with that obtained by Hattel and Pryds [10] for melt-spun steel ribbons. They reported that ribbon thickness is exponentially related to the wheel velocity. Measured chemical compositions of the obtained alloys are given in Table 1.
Table 1. Chemical compositions (in wt.%) of the obtained alloys.
|
|
|
CAM01
|
6.40
|
3.02
|
0.59
|
0.34
|
0.09
|
0.04
|
0.14
|
Balance
|
|
CAM03
|
6.31
|
3.03
|
3.80
|
0.32
|
0.08
|
0.03
|
0.13
|
Balance
|
|
CAM06
|
5.84
|
2.95
|
6.78
|
0.31
|
0.07
|
0.03
|
0.12
|
Balance
|
As-spun ribbons were characterized using optical microscopy (OM), scanning electron microscopy (SEM), transmission electron microscopy (TEM) and X-ray diffractometry (XRD) techniques. In order to compare the mechanical properties between the ribbons, the microhardness test was selected. The chilling surfaces (in contact with the copper wheel) and the cross sections of the melt-spun ribbons were characterized. High resolution transmission electron microscopy (HRTEM) was used in order to observe the structure present, mainly in the α-Al. SEM and TEM examinations were carried out using a JEOL JSM 6400 Model scanning electron microscope operated at 20 kV and a FEG-Philips Tecnai F20 transmission electron microscope operated at 200 kV, respectively. Specimens for OM and SEM investigations were mounted in an epoxy resin and prepared using standard metallographic techniques, followed by chemical etching in a solution of 2mL HF, 3 mL HCl, 5 mL HNO3 and 190 mL H2O for 15 seconds for structure observation. TEM specimens were prepared by dimpling using a Gatan 656 Dimple Grinder followed by Argon ion milling using a Gatan 691 Precision Ion Polishing System. The XRD measurements were carried out in a Siemens 400 X-ray diffractometer using CuKα radiation at 30 kV and 25 mA. Microhardness measurements were performed with a Vickers diamond indenter in a Leitz Wetzlar microhardness tester employing a load of 25 g. Statistical analysis was carried out to obtain reproducible and accurate results.
Results and Discussion
The morphology of ribbons for all experimental conditions was similar. Featureless layers were observed adjacent to the chilling surfaces while grains became coarser from the chilling surfaces to the free surfaces. A featureless zone is unique to rapidly quenched alloys [7] and it indicates good contact between ribbon and the wheel. The featureless layer thickness was always less than 5 μm. The structure was finer for the 45 ms−1 ribbons than for the 30 ms−1 one. At the chilling surfaces, the structure of the ribbons was dendritic equiaxed. The morphology of the 30 ms−1 ribbon with 0.59%Mg at the transverse cross-section and at the chilling surface is depicted in Figures 1a and 1b, respectively. Obviously the cooling velocity is the highest at the chilling surface. As a result, the featureless layer was obtained. Close to the free surface, the stability of the solid–liquid interface decreased with the reduction of cooling rate. Meanwhile, the structure coarsened. The solidification rate is directly proportional to the rotation speed [10]. For the rotation speeds used in our work, solidification rates were approximately 1.52 x 10⁷ and 2.11 x 10⁷ Ks-1 for the velocities of 30 and 45 ms-1 respectively. These data were calculated using the relationship derived by Matyja et al.[11], and correspond to dendrite arm spacing of 0.27 and 0.20 μm respectively.
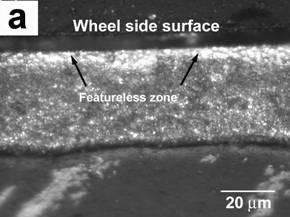
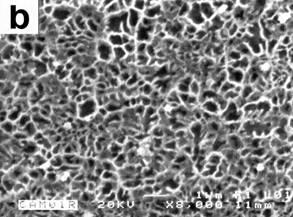
Figure 1. OM(a) and SEM-backscattered electrons (b) micrographs showing the morphology of the ribbon melt spun at 30 ms−1: (a) at the transverse cross-section and (b) at the chilling surface.
XRD spectra of 30 and 45 ms−1 ribbons are given in Figure 2. As expected, after melt spinning at a higher rotation speed the intensities of second phase peaks decreased. This means that the contents of free second phases are reduced, while alloying element contents in solid solution are increased. Q phase peaks of 30 ms−1 ribbons are easily discernible for the alloys with 3.80 and 6.78% Mg, while a small peak corresponding to θ was observed for the alloy with 0.59% Mg. For the 45 ms−1 ribbons, only diffraction peaks of the α-Al solid solution are present for the alloys with 0.59 and 3.80%Mg. A small peak of Q phase can be observed for the alloy with 6.78% Mg. This indicates that the rotation speed of the wheel, which is proportional to the cooling rate of the ribbon, also had a great influence on the content of the free second phases (θ and Q). From profiles A to C, the peaks of α-Al shift slightly to larger 2θ values, suggesting that more alloying elements are dissolved in the α-Al matrix.
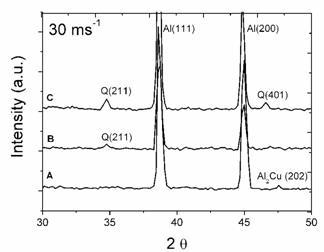
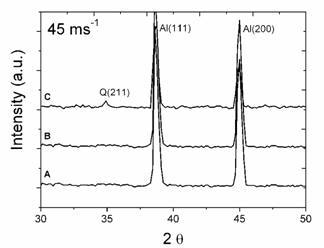
Figure 2. XRD profiles of ribbons at rotating speeds of 30 ms−1 and 45 ms−1 for the alloys with: (A) 0.59% Mg, (B) 3.80%Mg and (C) 6.78%Mg.
TEM bright field images of the melt-spun ribbons and their respective diffraction patterns are depicted in Figures 3a-f. The microstructure of the alloy with 0.59% Mg at 30 ms-1 is observed in Figure 3a, consisting of the α-Al matrix and particles of approximately 50-100 nm in diameter. The respective EDS analysis depicted in Figure 4a shows that the composition of the particles corresponds to Al2Cu, in agreement with the XRD observation. Figures 3b and 3c show small particles of approximately 10-30 nm in diameter for the alloys with 3.80 and 6.78% Mg. Chemical analyses of these particles show that they correspond to α-Al, as is shown in the EDS presented in Figures 4b and 4c. The formation of nanosized α-Al particles for these alloys could be explained due to the presence of a higher quantity of alloying elements (higher Mg content, as is observed by comparing Mg peaks of the EDS in Figures 4b and 4c), changing the content of the supersaturated solid solution.
![Bright field electron micrographs for alloys obtained at 30 ms-1 with: (a) 0.59% Mg, (b) 3.80% Mg and (c) 6.78% Mg and for the 45 ms-1 ribbons with: (d) 0.59% Mg, (d) 3.80% Mg and (e) 6.78% Mg. [Al2Cu and a-Al particles arrowed].](https://www.azom.com/images/Article_Images/ImageForArticle_3620_4423138776724548296.jpg)
![Bright field electron micrographs for alloys obtained at 30 ms-1 with: (a) 0.59% Mg, (b) 3.80% Mg and (c) 6.78% Mg and for the 45 ms-1 ribbons with: (d) 0.59% Mg, (d) 3.80% Mg and (e) 6.78% Mg. [Al2Cu and a-Al particles arrowed].](https://www.azom.com/images/Article_Images/ImageForArticle_3620_4423138777244211633.jpg)
![Bright field electron micrographs for alloys obtained at 30 ms-1 with: (a) 0.59% Mg, (b) 3.80% Mg and (c) 6.78% Mg and for the 45 ms-1 ribbons with: (d) 0.59% Mg, (d) 3.80% Mg and (e) 6.78% Mg. [Al2Cu and a-Al particles arrowed].](https://www.azom.com/images/Article_Images/ImageForArticle_3620_4423138777855324568.jpg)
![Bright field electron micrographs for alloys obtained at 30 ms-1 with: (a) 0.59% Mg, (b) 3.80% Mg and (c) 6.78% Mg and for the 45 ms-1 ribbons with: (d) 0.59% Mg, (d) 3.80% Mg and (e) 6.78% Mg. [Al2Cu and a-Al particles arrowed].](https://www.azom.com/images/Article_Images/ImageForArticle_3620_4423138778428249969.jpg)
![Bright field electron micrographs for alloys obtained at 30 ms-1 with: (a) 0.59% Mg, (b) 3.80% Mg and (c) 6.78% Mg and for the 45 ms-1 ribbons with: (d) 0.59% Mg, (d) 3.80% Mg and (e) 6.78% Mg. [Al2Cu and a-Al particles arrowed].](https://www.azom.com/images/Article_Images/ImageForArticle_3620_4423138779094917023.jpg)
![Bright field electron micrographs for alloys obtained at 30 ms-1 with: (a) 0.59% Mg, (b) 3.80% Mg and (c) 6.78% Mg and for the 45 ms-1 ribbons with: (d) 0.59% Mg, (d) 3.80% Mg and (e) 6.78% Mg. [Al2Cu and a-Al particles arrowed].](https://www.azom.com/images/Article_Images/ImageForArticle_3620_4423138779686345614.jpg)
Figure 3. Bright field electron micrographs for alloys obtained at 30 ms-1 with: (a) 0.59% Mg, (b) 3.80% Mg and (c) 6.78% Mg and for the 45 ms-1 ribbons with: (d) 0.59% Mg, (d) 3.80% Mg and (e) 6.78% Mg. [Al2Cu and α-Al particles arrowed].
The presence of fcc α-Al particles with a nearly spherical or an ellipsoidal morphology has been reported by Inoue et al. [12] for Al-Ni-Ce-Fe alloys. In all cases the diffraction patterns show the characteristic rings of α-Al, which indicates the presence of small size crystallites because of the rapid solidification process. Reflection rings corresponding to θ phase (Figure 3a) are not observed. This fact could be explained due to interplanar distances for this phase and α-Al being very close and it respective rings may be overlapping. For the 45 ms-1 ribbons the microstructure changes. The quantities of θ and α-Al particles decrease compared to the 30 ms-1 ribbons, as can be observed in the Figures 3d and 3f compared with Figures 3a and 3c. This result agrees with the XRD observations, where a reduction in the intensities of peaks corresponding to second phase was observed.
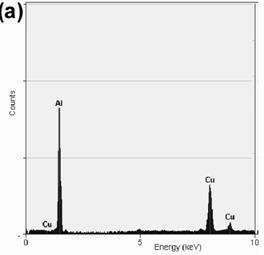
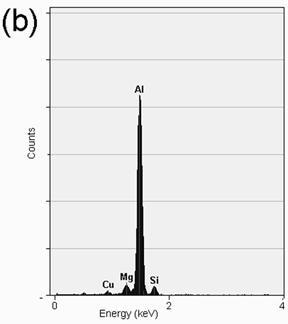
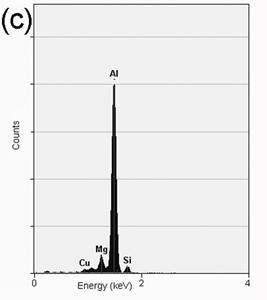
Figure 4. EDS analysis showing the chemical composition of: (a) Al2Cu particles present in the alloy with 0.59%Mg, (b) α-Al particles present in the alloy with 3.80%Mg and (c) α-Al particles present in the alloy with 6.78%Mg.
The presence of nanosized θ and Q particles was observed using HRTEM, in agreement with the results from the XRD analysis. As observed in Figure 5a, small θ nanocrystallites of approximately 2 nm in diameter are present in the α-Al matrix for the alloy with 0.59% Mg. Analyzing the structure of θ reveal us that orientation appears to be random, different from that for Guinier–Preston zones where intermediate compounds precipitate on preferential crystallographic planes of the Al matrix in age-hardened Al alloys. The obtained structure type is similar to that reported by Kim et al. [13] for other Al alloys. Fast Fourier Transforms (FFT) of two characteristic points are indexed to the micrograph, showing the frequencies associated with crystallites of θ and α-Al. An image with several crystalline domains corresponding to Q can be clearly seen for the alloy CAM03 (3.80% Mg) in Figure 5b. FFT revealed frequencies associated with crystallites of Q and α-Al, as also shown in Figure 5b. The size of this phase is in the range from 2 to 5 nm. The orientation in this case also appears to be random. Nanocrystallites of Q also appear for the alloy with 6.78% Mg.
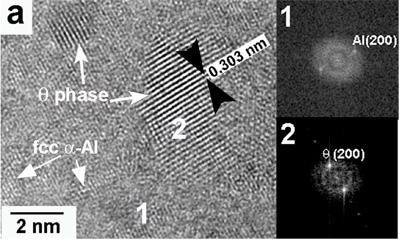
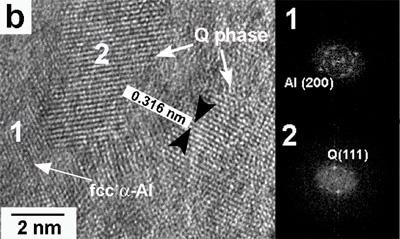
Figure 5. High-resolution images and their respective FFT showing the presence of: (a) fcc α-Al for the alloy with 0.59% Mg and (b) Q phase for the alloy with 3.80% Mg for the alloys obtained at 30 ms-1.
HRTEM images of the 45 ms-1 ribbons are shown in Figures 6a and 6b. For the alloy with low Mg content (0.59%), besides the θ particles observed using conventional TEM, a nanostructure composed of fcc α-Al particles surrounded by amorphous α-Al can be observed. The respective FFT demonstrate the presence of amorphous regions, which were not detected using conventional TEM, a fact that could be explained due to the low quantity of the amorphous phase. For the alloys with 3.80 and 6.78% Mg a nanostructure composed of fcc α-Al particles surrounded by amorphous α-Al is also observed. Nanosized Q particles surrounded by amorphous α-Al are also observed, as is shown in Figure 6b. This kind of amorphous-crystalline structure is similar to the short-range disorder and long-range order structure reported by Inoue [9], and that was reported as a new type of nonequilibrium structure which is different from amorphous, quasicrystalline and crystalline structures. It is further concluded that the fcc α-Al in coexistence with the amorphous phase is also a metastable phase enriched with the solute elements. This structural feature allows us to presume that the mixed structure is formed by the primary solidification of the amorphous phase, followed by the solidification of the remaining liquid as the fcc α-Al, θ or Q phase.
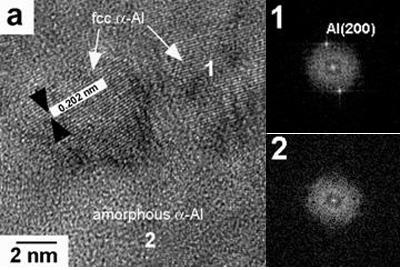
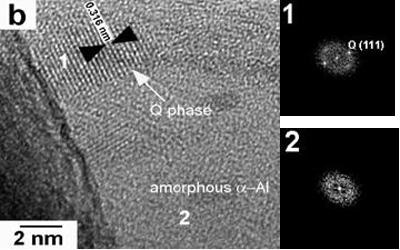
Figure 6. High-resolution images and their respective FFT showing the presence of: (a) fcc and amorphous α-Al for the alloy with 0.59% Mg and (b) Q phase and amorphous α-Al for the alloy with 3.80% Mg, for the alloys obtained at 45 ms-1.
Table 2 shows the values of microhardness for the ribbons obtained at different rotation speeds. Microhardness increases when Mg content increases from 0.59 to 3.80%. From 3.80 to 6.78% Mg microhardness remains constant. There are two important factors that can contribute to the microhardness increase for the alloys with higher Mg content: (1) a higher content of nanosized second phases and (2) the presence of a higher quantity of Mg in solid solution. It can be seen that the microhardness of the ribbons at 45 ms-1 is between 1.2 and 1.3 times the microhardness of ribbons obtained at 30 ms-1. With the increase of rotation speed the presence of an amorphous α-Al phase is the main cause of the increase in the microhardness values.
Table 2: Vickers Microhardness (VHN200p) for the experimental alloys using tangential speeds of 30 and 45 ms-1.
|
|
|
0.59%Mg
|
164.33 ± 6.87
|
205.31 ± 11.22
|
|
3.80%Mg
|
183.40 ± 8.64
|
225.00 ± 9.43
|
|
6.78%Mg
|
181.65 ± 9.21
|
233.15 ± 12.12
|
Conclusions
HRTEM analysis of the 30 ms-1 ribbons demonstrated the formation of a nanostructure composed of θ and α-Al for ribbons with 0.59 wt.% of Mg, while for ribbons with 3.80 and 6.78 wt.% of Mg the composition of the nanostructure corresponds to Q and α-Al. For the 45 ms-1 ribbons, regions of amorphous α-Al were observed. For the Al-Si-Cu-Mg alloys studied, it was not possible to obtain a perfect solid solution even using the melt spinning technique at high rotation speeds. The increase in Mg content leads to the formation of a higher quantity of Q and α-Al nanoparticles, which is the main cause of the increase in the microhardness for the alloys obtained at a constant rotation speed. The increase in rotation speed leads to a decrease in the quantity of free second phases, an increase in the quantity of alloying elements in solid solution and the formation of amorphous regions. These facts show that microhardness increases for the alloys obtained at the higher rotation speed.
Acknowledgements
The authors would like to thank F. Solorio, G. Lara and R.D. Cervantes for technical assistance and they also acknowledge the financial support provided by CIC and CGEP (UMSNH), México, and the material provided by Castech S.A. de C.V.
References
- P. Ouellet and F. H. Samuel, “Effect of Mg on the ageing behaviour of Al-Si-Cu 319 type aluminium casting alloys”, Journal of Materials Science, 34 (1999) 4671-4697.
- F. H. Samuel, A. M. Samuel and H. Liu, “Effect of magnesium content on the ageing behaviour of water chilled Al–Si–Cu–Mg–Fe–Mn (380) alloy casting”, Journal of Materials Science, 30 (1995) 2531-2540.
- Z. Li, A. M. Samuel, F. H. Samuel, C. Ravindran, and S. Valtierra, “Effect of alloying elements on the segregation and dissolution of Al2Cu phase in Al-Si-Cu 319 alloys”, Journal of Materials Science, 38 (2003) 1203-1218.
- W. H. Hunt Jr, “New directions in aluminum-based P/M materials for automotive applications”, The International Journal of Powder Metallurgy, 36 (2000) 51-60.
- F. J. Dom, “Meltspun aluminium successful in racing pistons”, Aluminium, 70 (1994) 575-578.
- H. H. Liebermann, “Rapidly solidified alloys made by chill block melt-spinning processes”, Journal of Crystal Growth, 70 (1984) 497-506.
- M. Lutfi, N. P. Unlu, N. Eruslu and A. Genc, “Characterization investigations of a melt-spun ternary Al–8Si–5.1Cu (in wt.%) alloy”, Materials Letters, 57 (2003) 3296-3301.
- A. Unlu, M. L. Genc, N. Ovecoglu, N. Eruslu and F.H. Froes, “Characterization investigations of melt-spun ternary Al – xSi – 3.3Fe (x = 10, 20 wt.%) alloys”, Journal of Alloys and Compounds, 322 (2001) 249-256.
- A. Inoue, “Amorphous, nanoquasicrystalline and nanocrystalline alloys in Al-based systems”, Materials Letters, 31 (1997) 130-140.
- J. H. Hattel and N. H. Pryds, “On the lack of dependence of extent of columnar growth on wheel speed for melt-spun 12Cr-Mo-V steel”, Scripta Materialia, 38 (1998) 723-727.
- H. Matyja, B. C. Giessen and N. J. Grant, “The effect of cooling rate on the dendrite spacing in splat-cooled aluminium alloys”, Journal of the Institute of Metals, 96 (1968) 30-32.
- A. Inoue, Y. Horio, Y. H. Kim and T. Masumoto, “Elevated-temperature strength of an Al88Ni9Ce2Fe1 amorphous alloy containing nanoscale fcc-Al particles”, Materials Transactions, 33 (1992) 669.
- Y. H. Kim, A. Inoue and T. Masumoto, “Ultrahigh mechanical strengths of Al88Y2Ni10-xMx (M=Mn, Fe or Co) amorphous alloys containing nanoscale fcc-Al particles”, Materials Transactions, 32 (1991) 599.
|