The surface of each component exhibits some form of roughness and texture, which differ owing to different production techniques and the structure of the part itself. In order to gain a better insight into the surface of a component and to manage the production process to the degree required in present applications, it is important to measure the surface in two and three dimensions (2D and 3D). Parameters for surface texture can be divided into the following categories:
- Spacing
- Roughness
- Waviness
- Hybrid
Terminology and Surface Texture Parameters
Cutoff filter measures the wavelength at which the surface structure is distinguished between waviness data and roughness. Appropriate selection of the correct filter cutoff in software is important for precise measurements; areal refers to a 3D surface area; profile refers to a 2D slice through an area; evaluation length refers to the area from which information is gathered.
It is a 2D area that corresponds to the slice length as defined in the filled plot, or a 3D area that corresponds to the instrument field of view; sampling length or cutoff length is the area chosen for evaluating the roughness parameter with the cutoff wavelength and surface unevenness spaced beyond the sampling length is considered waviness; mean line or center line refers to a straight line produced by measuring a weighted average for each data point, leading to equal areas below and above the line; and surface texture refers to the surface’s topography exhibiting certain deviations, which are characteristics of the real surface. It includes waviness and roughness.
In addition, hybrid parameters are combinations of roughness and spacing parameters; roughness parameters refer to the non-periodic finer unevenness in the surface texture during the manufacturing process; spacing parameters refer to a measure of the lateral or horizontal periodic characteristics of the surface; and waviness parameters refer to a larger component of surface texture on which roughness is overlayed.
Roughness Parameters
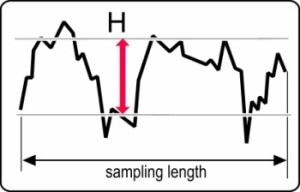
Figure 1. Sampling length
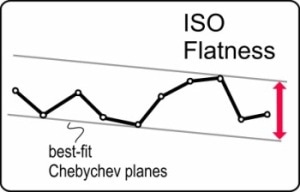
Figure 2. ISO flatness
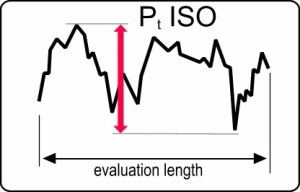
Figure 3. Pt ISO
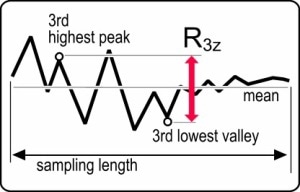
Figure 4. R3z
Among the largest set of parameters, roughness parameters include Swedish height (H), areal flatness deviation (ISO flatness), total peak-to-valley profile height (Pt ISO), base roughness depth (R3z), base roughness profile depth (R3z ISO), arithmetical mean deviation (Ra), Kurtosis (Rku),maximum peak-to-valley profile height.(Rmax ISO), highest peak (Rp), mean peak profile height (Rpm ISO), root-mean-square (rms) roughness (Rq (rms), maximum peak-to-valley height (Rt (PV), mean peak-to-valley roughness (Rtm), mean peak-to-valley profile roughness (Rtm ISO), lowest valley (Rv), mean valley profile depth (Rvm), maximum peak-to-valley roughness (), ten-point height (Rz), average peak-to-valley profile roughness (Rz ISO), total peak-to-valley areal height (SPt ISO), base roughness areal depth (SR3z ISO), maximum peak-to-valley height (SRmax ISO), mean peak areal height (SRpm ISO), mean peak- to-valley areal roughness (SRtm ISO), mean valley areal depth (SRvm ISO), average radial peak-to-valley areal roughness (SRz), average peak-to-valley areal roughness (SRz ISO), the average of individual Rz results, measured by slicing the data array in the x-axis (SRzX), and the average of individual Rz results, measured by slicing the data array in the y-axis (SRzY).
Waviness Parameters
Wq refers to the root-mean-square roughness of all points from a plane fit to the waviness data; Wa refers to the average roughness or average deviation of all points from a plane fit to the waviness data; and Wy (Wmax) refers to the maximum height of the waviness data.
Spacing Parameters
Pc (Peaks) refers to the number of peaks contained in the analysis; peak spacing is the average distance between peaks; peak density means the number of peaks per unit area; S refers to the average spacing between local peaks across the evaluation length; Sm refers to the average spacing between peaks at the mean line over the evaluation length; summits refer to the number of summits contained in the analysis; summit spacing is the average distance between summits; summit density is the number of summits per unit area; valleys refer to the number of valleys comprised in the analysis; valley spacing is the average distance between valleys; and valley density is the number of valleys per unit area
Hybrid Parameters
Δa (Slope Ra) is the arithmetic average surface slope of the entire data matrix; Δq (Slope rms) is the geometric average slope of the entire data matrix; Δtm (Slope Rtm) is the average peak-to-valley slope of nine sample areas on the whole data matrix; Iq is the root-mean-square deviation of all points from a plane fit to the input data; Ia is the average surface height, or average deviation, of all points from a plane fit to the input data; Iy (Imax) is the maximum height of the input data; Rvolume refers to the volume of the roughness data as specified by software as below or above the surface; RSurfAreaRatio is the ratio of roughness surface area to the planar area taken up by the data; ISurfAreaRatio is the ratio of input surface area to the planar area taken up by the data; and WSurfAreaRatio is the ratio of input surface area to the planar area taken up by the data. Other hybrid parameters include bearing ratio parameters such as Tp, Rk, Rpk, Rvk etc.
Conclusion
The above lists of surface texture parameters are essential to understand the surface of a component and to control the production process to the degree required in current applications.

This information has been sourced, reviewed and adapted from materials provided by Zygo Corporation.
For more information on this source, please visit Zygo Corporation.