Introduction
Magnesium alloys are the lightest metallic structure materials that are attracting more research interest because they have some specific properties like low density, good damping characteristics and stable machinability. However, magnesium alloys always have poor formability and limited ductility at room temperature due to the intrinsic characteristics of HCP structure [1-4]. Since non-basal slip systems can be activated at high temperatures (higher than the recrystallization temperature), hot deformation processes have been frequently proposed for magnesium alloys [5]. During hot deformation, some metallurgical phenomena such as work hardening (WH), dynamic recovery (DRV) and dynamic crystallization (DRX) may occur simultaneously [6,7] resulting in refinement of grains and reduction of deformation resistance. For magnesium alloys, due to its lower stacking fault energy (60-78 KJ/mol), DRX generally predominates during hot deformation (e.g. above 513 K) [8]. Based on the study of the recrystallization behaviors of Mg-0.8%Al at a temperature range of 423 K to 523 K, Ion et al. [9] suggested that the strain preferentially locate in the vicinity of initial grain boundaries when deformation temperature is lower than 603 K, and new grains are likely to form at some severely rotated sites (so-called “rotation recrystallization”) [9]. Tan et al. [10] studied the DRX behaviors of AZ31 alloy and proposed that grain refinement can be attributed to the continuous DRX process that was caused by the progressive formation of grain boundary disorientation and the change of low angle grain boundaries into high angle grain boundaries. Galiyev et al. [11] studied the relationship between DRX and deformation mechanism. However, most of these studies are concentrated on microstructure evolution, deformation mechanism or superplasticity. Only few reports are available about the conditions (e.g. critical strain) for DRX initiation, nor has the relationship between processing variables and final microstructures been thoroughly explored.
In the present study, we conducted hot deformation experiments on the AZ61 alloy and recorded the flow stress curves. Typical characteristics of the flow stress curves, i.e. the critical strain (εc), the peak strain (εp), the strain for maximum softening rate (εm) for DRX initiation were evaluated. Then, these parameters were formulated as functions of the Zener-Hollomon parameter with which the volume fraction of DRX can be predicated.
Experimental
An AZ61 alloy with chemical compositions of Mg-5.8Al-1.0Zn1.0-0.18Mn-0.003Cu in weight percent was made by chill casting. The ingots were solutionized at 673 K for 15 h. Cylindrical specimens of φ10×15mm were cut out from these ingots. Hot compression was performed on a Gleeble 1500 machine. Prior to hot compression, the specimens were heated to the deformation temperature in 5 min. The deformation temperature was measured by thermocouples that were welded onto the center of a specimen surface. The deformation strain, temperature and strain rate were automatically controlled and recorded. Compression was conducted in a temperature ranging from 523 K to 673 K. The strain rates were varied from 0.001s-1 to 1s-1. The total true strain was 1 in all experiments. After hot compression, the specimens were water-quenched. Samples for microstructure observations were cut from compressed specimens along the sections parallel to the compression axis. Grain sizes were studied by the linear intercept method.
Results and Discussion
Analyses of Flow Curves
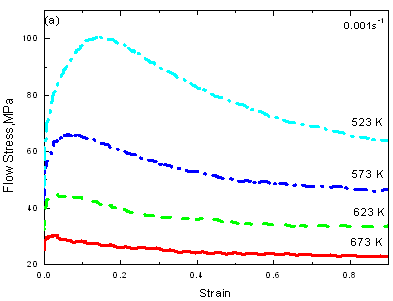
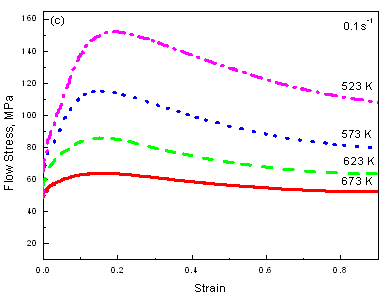
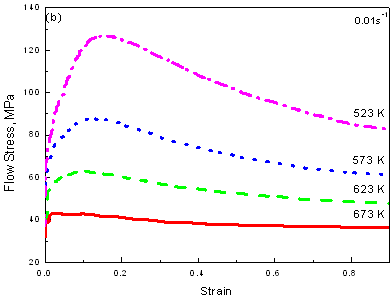
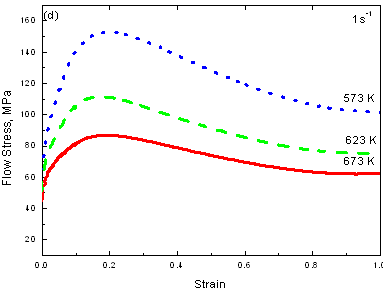
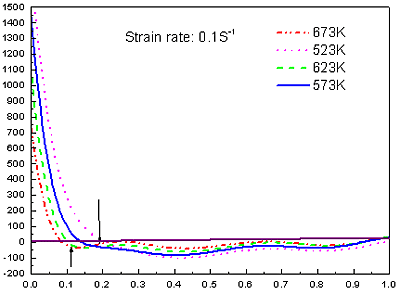
Figure 1 shows the stress-strain curves of the AZ61 alloy under different deformation conditions. The general characteristics of the flow stress curves are similar at all deformation conditions. The flow stress increased to a peak (initial strain hardening) and then decreased to a steady state. Generally, such flow stress behaviors are typical characteristics of hot working that is accompanied by DRX [12, 13], which can be described by the thermally activated stored energy developed during deformation controls softening mechanisms [11]. With decreasing strain rate or increasing temperature, the strain hardening effect becomes weaken, while the degree of strain softening becomes notable (e.g. 673 K). As a result, the peak stress varies according to processing parameters, so does the peak strain. Under a constant strain rate, the peak stress and the peak strain increased with decreasing temperature. Under the same temperature, the peak stress and the peak strain increased with increasing strain rate. Thus, it can generally be concluded that DRX is responsible for the high temperature deformation mechanism of AZ61 alloy and can be confirmed by comparison of microstructures.
|
|
|
Figure 1. Flow stress-strain curves of AZ61 alloy in compression.
|
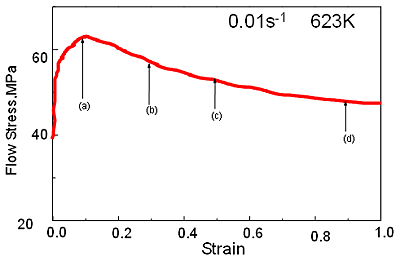
Figure 2 shows microstructural evolution along with the strain when temperature was 623 K and strain rate was 0.01s-1. The microstructure of the specimen at the peak strain (0.10) is composed of both strain-hardened grains and DRX grains. When strain is larger than the peak strain, the volume fraction of DRX increases gradually. When the strain is large enough (e.g. 1.0), only DRX grains can be observed. Especially, Figures 2a and 2b show the recrystallized grains along the original grain boundaries.
|
|
|
Figure 2. Flow stress curve and microstructures under 623 K and 0.01 s-1
(a) ε=0.10, (b) ε=0.3,(c) ε=0.5, (d) ε=1.0..
|
Θ-σ Analysis
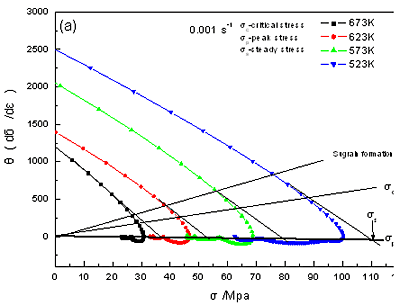
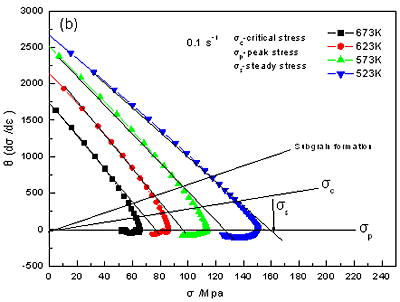
The flow stress dependence of the strain hardening rate Θ (dσ/dε) is illustrated in Figure 3 at various conditions. The strain hardening rate decreases rapidly at early stage of deformation. However, the decreasing rate changes with temperature and strain rate. As the temperature decreases and strain rate increases, Θ linearly increases. For instance,

as the flow stress increases, the rate of decrease of Θ decelerates until the critical stress (σc) corresponding to the occurrence of DRX is reached, and then it changes until Θ reaches to zero at which the flow stress approaches its peak, and then keeps steady. It should be noted that the point at Θ=0 is just the inflection different from other alloys [11]. In most of the curves of Θ, Θ ~ 0 after the curves are the inflection point. This illustrates that strain hardening rate and strain softening rate balance each other after the peak stress. As shown in Figure 3, the Θ-0 curves can be divided into four segments. The approximately linear segment of the Θ-0 curve is extrapolated to Θ=0 with an idealized method [14]. Based on this method, critical stress (σc), peak stress (σp) and saturation stress (σs) can be obtained. When the critical stress (driving force) originated from a large difference in dislocation density within sub grains or grains is attained, new grains or subgrains are nucleated along the grain boundaries, twin bands and dislocations, resulting in equiaxed DRX grains [15].Therefore, DRX can be decided by the Θ-0 curve, and the formation of substructures can be predicated [14, 16].
|
|
|
Figure 3. Flow stress dependence of the strain-hardening rate at different conditions,
(a) ε =0.001s-1, (b) ε=0.1s-1.
|
Figure 4 shows the analysis of Θ – ε curves at various deformation conditions. These curves indicate the evolution of DRX with strain. The strain that corresponds to the maximum softening rate (εm) increases with increasing strain rate or decreasing temperature. From such a curve, the onset and finish of DRX, i.e. the peak strain (εp) and the strain for maximum softening rate (εm) can be decided. The negative values of Θ means that softening is progressed against ε. Therefore, a minimum value of Θ corresponds to the maximum softening rate, after which the evolution of DRX over the strain slowly decreases and then approaches to the steady state.
|
|
|
Figure 4. Strain hardening rate-strain curves to determine the strain for maximum softening rate.
|
|
|
|
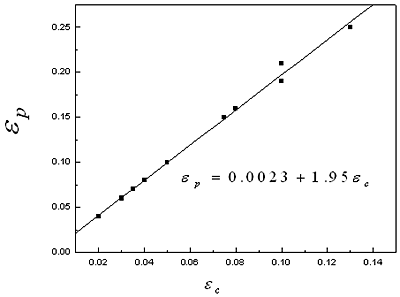
Figure 5. Relationship between ε c- ε p.
|
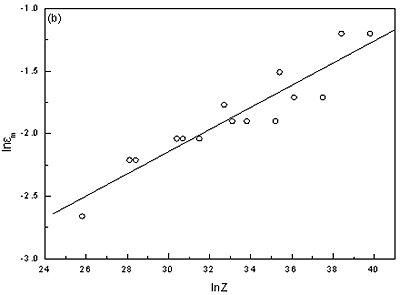
Based on the analysis of σ – ε, Θ - σ, and Θ - ε, equations ((1)-(3)) can be obtained through linear regression shown in Figures 5, 6 and 7.
|
εp =0.0023+1.95εc
|
(1)
|
|
ln εp = -5.97 +0.110ln Z
|
(2)
|
|
ln εm =-4.796+0.088ln Z
|
(3)
|
Here Z is the Zener-Hollomon parameter
(Z=  exp((185KJmol-1/RT))[17] exp((185KJmol-1/RT))[17]
This suggests that εp and εm has a linear relationship with 1n Z.
In equation (1), because the first item on the right of is very small (0.0023), it can be simplified as εp = 1.95 εc. Thus,
εc ≈ 0.5εp (4)
Apparently, equation (4) is different from the formula εc =0.6-0.8 εp of micro-alloyed steels [18], indicating that the initiation of DRX of magnesium alloy is easier than that of micro-alloyed steel.
From equations (2) and (4), εc can also be assumed to have a linear relationship with ln Z (Eq.(5)). Thus, εc , εp and εm are all linearly related to ln Z.
ln εc = 6.80+0.110ln Z (5)
Predication of Recrystallized Volume Fraction
During hot deformation, grain refinement was achieved by DRX that generally occurred at grain boundaries and deformation bands. Microstructure observations suggest that DRX grains are almost equally sized and equiaxed, as shown in Figure 2. However, the volume fraction (Xd) of DRX was changed with deformation conditions. Generally, the kinetics of DRX can be described by an Avrami’s equation (Eq.(6)) [19], based on which the volume fraction of DRX grains during high temperature deformation can be predicted.
Xd =1-exp[-k((ε-εc)/ εp)m] (6)
Here, k, m are Avrami constants respectively. Using experimental data and nonlinear regression, the following formula can be obtained.
Xd=1-exp[-0.26((ε-εc)/ εp)1.05] (7)
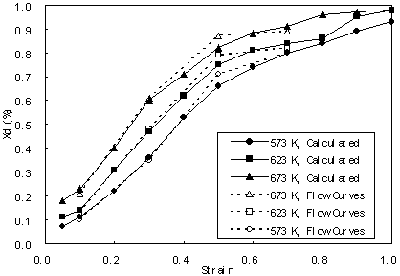
Since εp and εm are functions of the Z-parameter, Xd is also a function of Z-parameter. This suggests that Xd should vary with temperature, strain and strain rate. Figure 7 (a) shows the predicated volume fraction of DRX with equation (7) at various conditions.
Figure 7 (b) shows the calculated Xd at various deformation conditions based on the method of flow curves [20]. Compared with Figure 7 (a) and (b), it is found that the predicated results are agreed with the calculated results based on flow curves. All the Xd curves display S shape.
|
(a)
(b)
|
|
Figure 6. Dependence of εp and εm on Ln Z (a) ln εp –ln Z, (b) ln εm –ln Z. on Ln Z (a) ln εp –ln Z, (b) ln εm –ln Z.
|
|
|
|
Figure 7. Comparison between Xd predicated by equation (6) and that calculated from flow curves.
|
Microstructure and Grain Size of DRX
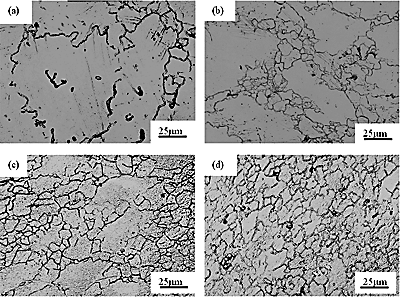
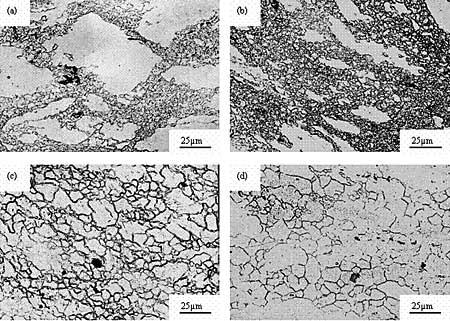
Figure 8 shows the evolution of microstructures at the strain rate of 0.01 s-1 and various temperatures with strain of 1.0. As shown in Figure 8 (a) ~ (b), at 523 K~573 K, the grains were broken and elongated.
|
|
|
Figure 8. Micrographs of AZ61 alloy with strain rate 1×10⁻²s-1.
(a) 523 K, (b) 573 K, (c) 623 K, (d) 673 K.
|
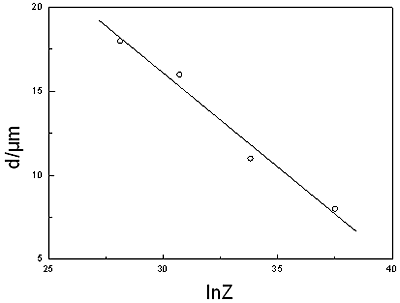
DRX occurred partially and the grain distribution was heterogeneous. Most recrystallized sites were composed of necklace structure, which was strongly dependent on the crystallographic orientation of the grain. Since gradients near the grain boundaries provided potential nucleation site for DRX [21], DRX generally initiated at grain boundaries and finally replaced original grains [22]. Above 573 K, DRX finished completely, and the DRX grains have a homogeneous distribution. The new grains completely replaced the original grains with features of equiaxed grains. When the average size of DRX grains (d) in each image is plotted with the logarithm value of corresponding Z as the horizontal axis, Figure 9 is obtained. As the plot shows, d can be formulated as a linear function of Z (Eq.(7)).
D=49.56-1.012ln Z (8)
|
|
|
Figure 9. Relation between grain size and Zener-Hollomon parameter.
|
Conclusions
The AZ61 alloy was subjected to hot compression at temperatures ranging from 523 K to 673 K, with strain rates of 0.001 ~ 1s-1. DRX behaviors of the alloy during hot compression processes are studied by flow curve analyses and microstructure observations based on the flow softening mechanism. Main conclusions are as following.
• The critical strain (εc) and the peak strain (εp) have a linear relationship, i.e.

based on which εc can be obtained from the easily measurable εp.
• Based on the studies of the flow stress curves, the peak strain (εp), the critical strain (εc) and the strain corresponding to the largest softening rate are formulated to be functions of lnZ, i.e. Eq. (2), Eq.(3) and Eq.(5) respectively.
• The volume fraction of DRX (Xd) can be described by an Avrami equation in terms of processing parameters including the strain rate ( ), process temperature (T), and strain (ε), as defined by Eq.(7). ), process temperature (T), and strain (ε), as defined by Eq.(7).
• The average size of DRX grains (d) is formulated as a function of the Zener-Hollomon parameter, as Eq.(8).
Acknowledgements
The authors would like to acknowledge financial support of Ministry of Science and Technology (High Technology Plan No 2001AA310301) and Shanghai Key Project of Fundamental Research (03JC14045) of P. R. China.
References
1. O. D. Sherby, T. G. Nieh and J. Wadsworth, “Some thoughts on future directions for research and applications in superplasticity”, Materials Science Forum, 243~245 (1997) 11.
2. T. Mukai, H. Watanabe, and K. Higashi, “Application of superplasticity in commercial magnesium alloy for fabrication of structural components”, Material Science and Technology, 16 (11~12) (2000) 1314.
3. M. Loreth, J. Morton, K. Jacobson, F. Katrak and J. Agarwal, “Magnesium’s future in automotive components: competing for the lightweight market in North America” in: S. MacEwan, J. P. Gilardeau (Eds.), Recent Metallurgical Advances in Light Metals, Met. Soc. CIM, Montreal, 1995, pp11-24.
4. ASM Specialty Handbook. Magnesium and Magnesium alloys. Materials Park, Ohio: ASM International, (2000) 2.
5. B. Closset, “Mechanical properties of extruded magnesium alloys”, Magnesium and magnesium alloys. Materials Park, Ohio: ASM International, (2000) 275.
6. C. Roucoules, S. Yue and J. J. Jonas, “Effect of alloying elements on metadynamic recrystallization in HSLA steels”, Metall. Mater. Trans., A26 (1995) 181.
7. C. Roucoules, P. D. Hodgson, S. Yue and J. J. Jonas, “Softening and Microstructural Change Following the Dynamic Recrystallization of Austenite”, Metall. Mater. Trans., A25 (1994) 389.
8. M. Mabuchi, K. Ameyama, H. Iwasaki and K. Higashi, “Low temperature superplasticity of AZ91 magnesium alloy with non-equilibrium grain boundaries”, Acta Mater., 47 [7] (1999) 2047.
9. S. I. Ion, F. J. Humphrys and S, H. White, “Dynamic recrystallization and the development of microstructure during the high temperature deformation of magnesium”, Acta Metal., 30 (1982) 909.
10. J.C. Tan and M.J. Tan, “Dynamic continuous recrystallization characteristics in two stage deformation of Mg-3Al-1Zn alloy sheet”, Mater. Sci. and Eng., A339 (2003) 124.
11. A. Galiyev, R. Kaibyshev and G. Gottstein, “Correlation of plastic deformation and dynamic recrystallization in magnesium alloy ZK60”, Acta Metall., 49 (2001) 1199.
12. T. Sakai and J. J, Jona, “Dynamic Recrystallization: Mechanical and Microstructural Considerations”, Acta metal., 32 (1984) 189.
13. F. J. Humphreys, “Network model for recovery and recrystallization”, Scr. metal. mater., 27 [11] (1992) 1557.
14. N. D. Ryan and H. J. McQueen, “Dynamic Softening Mechanisms in 304 Austenitic Stainless Steel”, Can. Metal. Q., 29 (1990) 147.
15. A, Mwembela, E, Konopleva and H. J.McQueen, “Microstructural development in Mg alloy AZ31 during hot working”, Scripta Mater., 37 (1997)1789.
16. N. D. Ryan, H. J. McQueen and E. Evangelista, “Dynamic Recovery and Strain Hardening in the Hot Deformation of Type 317 Stainless Steel”, in metallurgy and Materials Science (Edited by N. Hansen et al.), pp527-534, National Laboratory, Roskilde, Denmark, (1986).
17. H.T. Zhou, X.Q, Zeng, C.J. Ma and W.J. Ding, “A flow stress model for AZ61 alloy”, Acta Metallurgica, sinica, 17 (2004) 155.
18. B. C. Ko and Y. C. Yoo, “Hot-deformation behaviour of AA2124 composites reinforced with both particles and whiskers of SiC”, Mater. Sci. Technol., 58 (1998) 479.
19. M. J. Luton and C. M. Sellars, “Dynamic recrystallization in nickel and nickel-iron alloys during high-temperature deformation”, Acta Metall., 17 (1969) 1033.
20. W. M. Mo and X. B. Zhao, “Dynamic recrystallization”, in: Recrystallization and grain growth (in Chinese)”, Metallurgical industrial press, Beijing, 1994, pp 345.
21. R. O Kaibyshev and B. K. Solokov, “Influence of Crystallographic Texture on Slip and Dynamic Recrystallization of Magnesium Alloys “, Phys. Met. Metall., 741 (1992)72.
22. R. O. Kaibyshev and O. S. Sitditkov, “Structural Changes During Plastic Deformation of Pure Magnesium”, Phys. Met. Metall., 736 (1992) 635.
Contact Details
|
Liufa Liu
National Engineering Research Center of Light Alloys Net Forming,
School of Material Science and Engineering
Shanghai Jiao Tong University
Shanghai 200030,
P.R. China
Email: [email protected]
|
Haitao Zhou
National Engineering Research Center of Light Alloys Net Forming,
School of Material Science and Engineering
Shanghai Jiao Tong University
Shanghai 200030,
P.R. China
|
|
Qudong Wang
National Engineering Research Center of Light Alloys Net Forming,
School of Material Science and Engineering
Shanghai Jiao Tong University
Shanghai 200030,
P.R. China
|
Yangping Zhu
National Engineering Research Center of Light Alloys Net Forming,
School of Material Science and Engineering
Shanghai Jiao Tong University
Shanghai 200030,
P.R. China
|
|
Wenjiang Ding
National Engineering Research Center of Light Alloys Net Forming,
School of Material Science and Engineering
Shanghai Jiao Tong University
Shanghai 200030,
P.R. China
|
|
|