Thermo Scientific has been at the forefront of ultra-fast spark OES investigation of nonmetallic micro-inclusions for over 20 years. The Thermo Scientific™ ARL iSpark™ Plus Optical Emission Spectrometer’s Spark-DAT inclusion analysis expands on this extensive experience and the numerous advancements and breakthroughs it has made possible.
Leading steel firms employ Thermo Scientific’s spark OES inclusion analysis solutions globally, and the number of businesses using them each year increases in the non-ferrous metals, aluminum, and steel sectors.
This product page outlines the methodology, software tools, and application support choices for inclusion analysis.
Ultra-Fast Inclusion Analysis
For inclusion analysis, the ARL iSpark Plus with Spark-DAT offers unmatched speed. It allows for exceptionally effective control over the quality of the metal and the production process by providing the combined results of elemental and inclusion analysis in a single test in roughly the same amount of time as elemental analysis alone.
This implies that inclusions can be assessed in all samples that the OES spectrometer analyzes in concentration, up to several hundred samples daily. As a result, a plethora of insightful inclusion data may be gathered to continuously enhance process effectiveness and product quality.
Key Benefits
- A measurement that combines elemental analysis with inclusion analysis
- Checks for inclusion in hundreds of samples almost instantly each day
- Significant cost savings because less expensive inclusion issues arise
- Specifically tailored for ARL iSpark Plus automation with ARL SMS (Sample Manipulation System)
- No changes to the way the ARL iSpark Plus operates or the sample preparation process
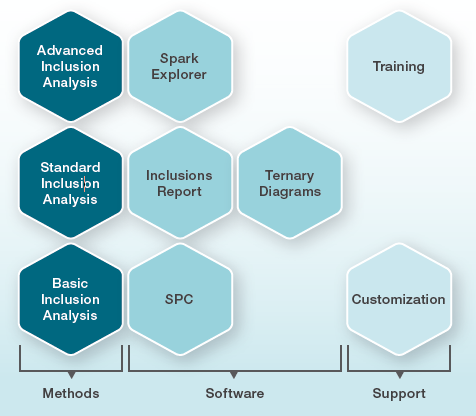
Options for Spark-DAT inclusion analysis. Image Credit: Thermo Fisher Scientific – Production Process & Analytics
Inclusion Analysis Methods
Up to three different Spark-DAT inclusion analysis methods are available, depending on the metal or alloy of the samples to be studied. Elemental analysis is used in conjunction with Basic Inclusion Analysis, Standard Inclusion Analysis, and Advanced Inclusion Analysis. They come with the ARL iSpark Plus ready to use.
They can frequently be added to elemental analysis techniques currently used in lab using the ARL iSpark Plus.
The table provides an overview of the key characteristics and features of the various inclusion analysis techniques.
Principal features and specificities of the different inclusion analysis methods.* by inclusion type. Source: Thermo Fisher Scientific – Production Process & Analytics
| |
Inclusion analysis method |
| |
Basic |
Standard |
Advanced |
| Available for |
Low alloy steel |
All metals and alloys |
Low alloy steel |
| Types of inclusions measurable |
Main |
Many |
Many |
| Qualitative/Quantitative data |
Qualitative |
Qualitative |
Both |
| Special feature |
Dedicated report |
Customizable |
Customizable |
| Typical inclusion data obtained |
| Number* |
✓ |
✓ |
✓ |
| SML classification* |
✓ |
✓ |
✓ |
| Size and size distribution* |
|
|
✓ |
| Inclusion volume fraction* |
|
|
✓ |
| Inclusion concentration* |
|
|
✓ |
| Oxygen content |
|
|
In killed steel |
| Available software options |
| Spark Explorer |
✓ |
✓ |
✓ |
| Inclusions Report |
|
✓ |
✓ |
| Ternary Diagrams |
|
|
✓ |
| SPC |
✓ |
✓ |
✓ |
Basic Inclusion Analysis
The Basic Inclusion Analysis, an introductory technique for low-alloy steels, assesses the inclusions of several significant elements, such as Al, Ca, Mg, and S (e.g., calcium sulfides, aluminum oxides, and calcium aluminates). A printable one-page report with the inclusion analysis results is also included with Basic Inclusion Analysis.
Standard Inclusion Analysis
The Standard Inclusion Analysis method is available for all metals and alloys that can be analyzed with the ARL iSpark Plus, including Fe, Al, Cu, Ni, Co, Pb, Zn, Sn, Mg, Ti, Ag, Au, Pd, and Pt. This allows for the evaluation of the properties of a wide range of inclusions with varying compositions.
Advanced Inclusion Analysis
The Advanced Inclusion Analysis method is a full-capability approach for low-alloy steels that enables the evaluation of both the same inclusion properties as the Standard Inclusion Analysis method and additional, more advanced ones, such as inclusion volume % and ESD (equivalent sphere diameter) in μm.
For further information on the distinctions between Basic, Standard, and Advanced Inclusion Analysis, explore the table and the Inclusions Report page.
OXSAS Analytical Software
Where the Heart of Inclusion Analysis Beats
The program that runs the ARL iSpark Plus and oversees every facet of the elemental analysis is called OXSAS. OXSAS also comes with the entire suite of Spark-DAT tools required to perform the inclusion analysis method of choosing, from setup to handling findings through the gathering and processing of inclusion data.
Specifically, it consists of the quick, statistically-based Spark-DAT algorithms that transform individual spark signals into useful inclusion data.
Following analysis, OXSAS presents the inclusion data together with the element concentrations. Similar to the concentrations, the inclusion data can be sent to statistical process control software, a LIMS, or another computer.
Quality Data in Quantity
Spark-DAT techniques have the capacity to produce enormous amounts of data about the various inclusion types (i.e., compositions) that are present in the sample. The OXSAS analysis software can handle an almost infinite number of results, thus this is not an issue.
The inclusion data is enhanced in terms of quality by the high efficacy of Spark-DAT algorithms, which employ statistical techniques that are specifically created and enable an ideal evaluation of the inclusions’ composition.
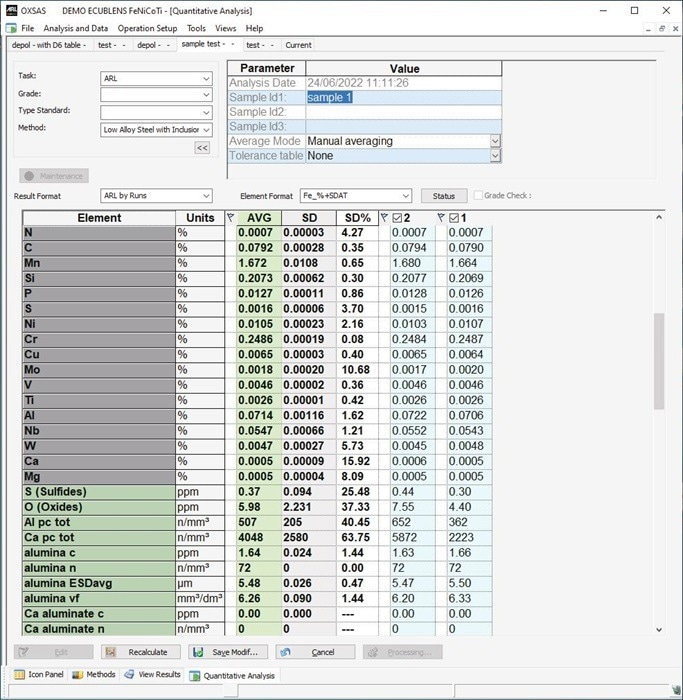
Result display of a two-run advanced inclusion analysis combined with elemental analysis of a low alloy steel sample. Image Credit: Thermo Fisher Scientific – Production Process & Analytics
Key Features
- Almost no restrictions on the number of properties included
- Ability to recalculate inclusion properties following changes to Spark-DAT algorithm parameters
- Effective discrimination of inclusions of different compositions
- Editor of classes for single spark intensity and size distributions
- Data transmission to statistical process control software, LIMS, or remote computer
- Raw data in.txt and.csv formats for use in commercial software
Software Tools for Inclusion Analysis
Spark Explorer
Understand What Lies Beyond Numbers
When users need to better understand any inclusion analysis results or wish to refine the method, exploring the raw inclusion data becomes vital. This is why Spark-DAT Explorer was developed, and it will enable the user to work effectively with the so-called single spark signals utilized in inclusion analyses.
It provides many helpful features as well as multiple methods for visualizing and contrasting the signals corresponding to inclusions on various element channels or in various samples.
The parameters of techniques and algorithms can be dynamically changed with Spark Explorer to achieve the best possible ultra-fast inclusion analysis. Investigating and documenting in the event of a problem with product quality or manufacturing issues are two examples of effective uses.
Key Features
- Show single spark run charts for an infinite number of samples, runs, and elements.
- Interactive computation of statistical data and other important inclusion figures, such as peak counts and the insoluble ratio
- Graphical adjustment of the detection threshold of inclusion signals (intensity peaks)
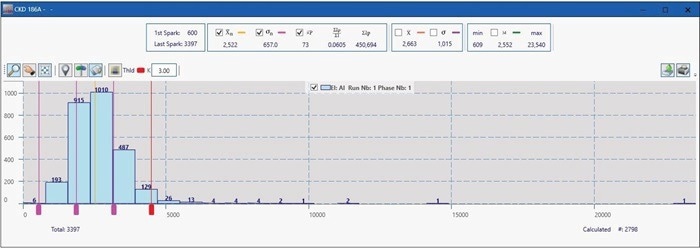
- Distribution histograms
- Run chart, histogram, and S-chart of the single spark intensity signals displayed simultaneously
- Reports printed out and charts exported to picture files
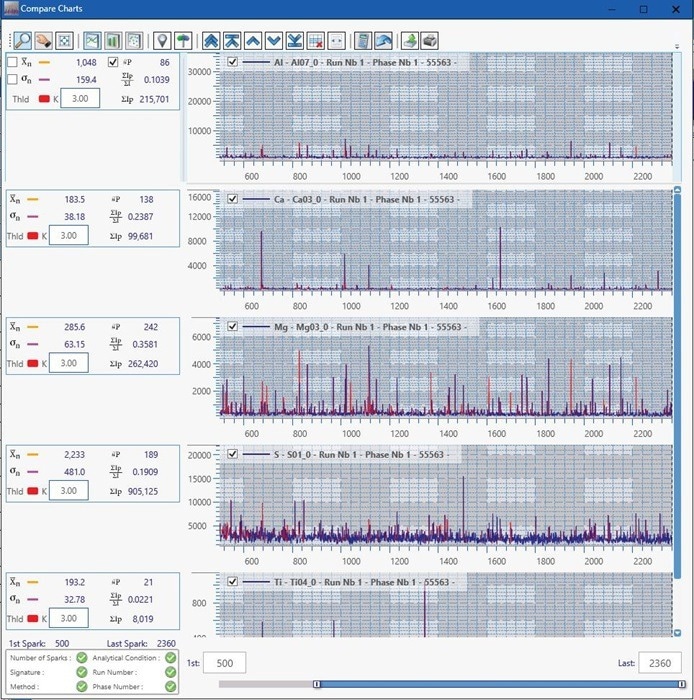
Comparison of single spark signals of Al, Ca, Mg, S and Ti in a low alloy steel sample. Image Credit: Thermo Fisher Scientific – Production Process & Analytics
Display of S-chart, run chart and histogram of Al single spark signals in a low alloy steel sample. Image Credit: Thermo Fisher Scientific – Production Process & Analytics
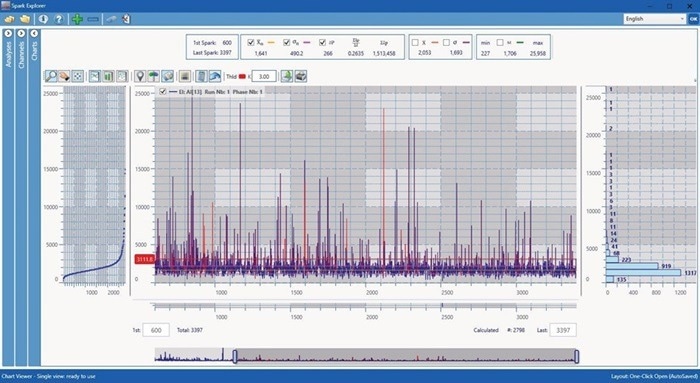
Distribution histogram of Al single spark intensities in a low alloy steel sample. Image Credit: Thermo Fisher Scientific – Production Process & Analytics
Inclusions Report
A Digest of the Inclusion Data
With the Inclusions Report option, a single, dedicated document contains all the data and information needed for the inclusion review. The preferred instrument for thoroughly examining inclusion analysis, recording and preserving results, or sending information to experts in the divisions or roles within the business involved with inclusion concerns is the inclusions report (e.g., defectology and process specialists).
Depending on the inclusion analysis method chosen, the document’s parts and contents can be changed.
Key Features
- Items that are compatible with both Advanced and Standard Inclusion Analysis
- The evaluated sample material’s surface, volume, and mass
- The sample’s elemental composition; and the user-defined primary inclusion indices
- Relative size distribution and inclusion counts (SML classification)
- Furthermore, contents with Advanced Inclusion Analysis are offered, including
- Size distribution (in μm)
- Inclusion concentrations (in ppm)
- Inclusion volume fractions (in mm³/dm³)
- Determination of low oxygen concentrations in dead steels
- Ternary Diagrams (option)
- Concentration of soluble/insoluble fractions of elements (e.g., Al, B, and Ti) if option chosen
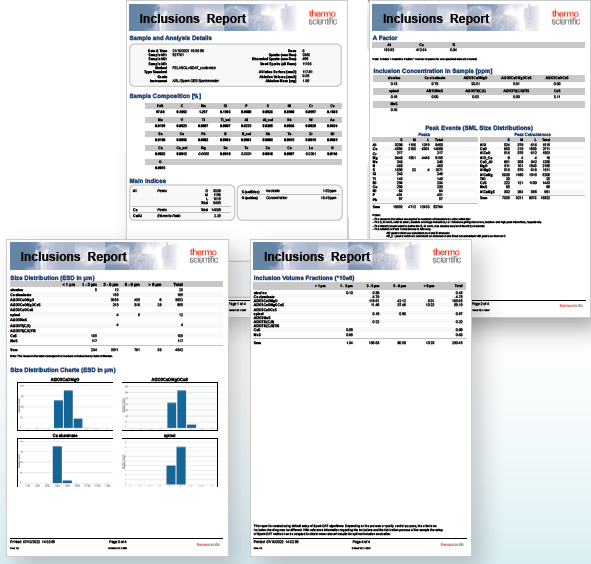
Example of an inclusion analysis report of a low alloy steel sample measured with Advanced Inclusion Analysis method. Image Credit: Thermo Fisher Scientific – Production Process & Analytics
Ternary Diagrams
Snapshots of the Inclusion Population
Ternary diagrams, such as those for Al₂O₃–CaO–MgO or Al₂O₃–CaO–MnS, illustrate the size distribution and composition of inclusions comprising one to three chemical components. Usually, they offer a picture of the included population at a specific stage of the production process.
For example, ternary diagrams make it possible to monitor how the aluminum oxides change when treated with calcium. The Ternary Diagrams software module, which is an option for Advanced Inclusion Analysis in low alloy steel and Inclusions Report, is used to generate them.
Key Features
- Size classes in μm
- Inclusions per mm³, broken down by size class
- The average inclusion composition expressed as a percentage and shown on the diagram as a dot
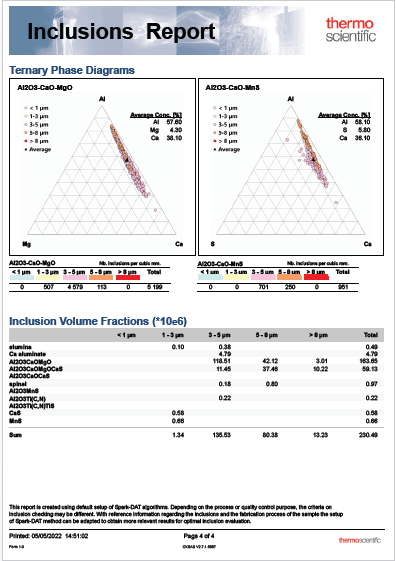
Examples of ternary diagrams in an inclusion analysis report. Image Credit: Thermo Fisher Scientific – Production Process & Analytics
SPC
A Most Effective Way for Inclusion Control
OXSAS can transfer inclusion data measured with the ARL iSpark Plus to statistical process control (SPC) software, enabling straightforward, essentially online inclusion control. SPC software is a great choice for businesses looking to reduce scrap, rework, and non-compliant goods as well as inclusion-related problems.
Key Features
- Upper Specification Limit (USL) set by the user
- Incident warnings, which usually occur when the specification limit is exceeded, and trend notices, such as an increasing drift in the number of inclusions
- Can be applied to inclusion data and element concentrations at the same time
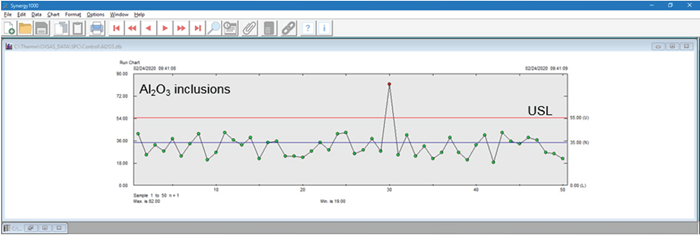
SPC run chart of aluminum oxides in 50 steel production samples. Number of inclusions in sample 30 is above USL, which signifies that its inclusion content is not compliant. Image Credit: Thermo Fisher Scientific – Production Process & Analytics
Application Support
Thermo Fisher Scientific experts offer a variety of support solutions to tailor the techniques to the unique requirements of materials analysis and staff training.
Customization
The type and quantity of inclusions present in the samples might differ significantly based on the production method and the metal grade used. For this reason, the Spark-DAT method’s configuration—either Standard Inclusion Analysis or Advanced Inclusion Analysis—is extremely important.
To customize the Spark-DAT analysis during the production of the ARL iSpark Plus as closely as possible to the demands, the application specialists will be pleased to talk with the user.
When more precise procedure modifications are required, there are more alternatives available. The ability to visit the Ecublens, Switzerland location and work with the staff to tailor the process before sending the ARL iSpark Plus is truly helpful and appreciated.
Image Credit: Thermo Fisher Scientific – Production Process & Analytics
Training
For those new to Spark-DAT inclusion analysis and who want to independently develop new methods or optimize their current ones, a training session is advised. There are several ways to get training, including through remote online sessions or at one of the regional application laboratories.