Chemical manufacturers and oil refineries are required to measure the component concentration of waste gas streams moving towards the flare according to new environmental regulations such as the EPA’s 40 CFR 60 subpart Ja.
This EPA regulation mandates the analysis of Total Sulfur, hydrogen sulfide, and BTU content in the flare gas released from US refineries by November 2015.
Since flare streams consist of a range of components of varying concentrations, mass spectrometry is ideal for flare monitoring application, as it is capable of delivering real-time data on total sulfur, hydrogen sulfide, hydrocarbon content, and BTU of the sample.
Besides providing the Flare CEMS measurements mandated by Subpart Ja, mass spectrometry delivers speciated hydrocarbon and sulfur data for root-cause analysis in the case of a reportable release.
This article discusses the use of an Process Insights MAX300-IG process control mass spectrometer (Figure 1) to measure a range of simulated flare conditions. The MAX300-IG can perform quantitative analysis for a number of compounds at a concentration range of 100% down to 10ppb. The mass spectrometer uses a 19mm quadrupole mass filter for improved sample throughput, yielding long-term stability and high analysis repeatability.
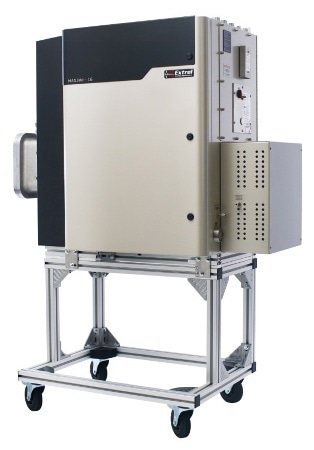
Figure 1. The MAX300-IG process control mass spectrometer
Dynamic Range and Linearity of Hydrogen Sulfide
Different sulfur compounds down to ppm levels are typically present in flare gas waste streams, including hydrogen sulfide (H2S), carbonyl sulfide (COS), sulfur dioxide (SO2), and carbon disulfide (CS2). This experiment simulated a variety of potential plant conditions using blended gas bottles to demonstrate the accuracy and linearity of the MAX300-IG measurements for H2S (Figure 2) and Total Sulfur (Figure 3).
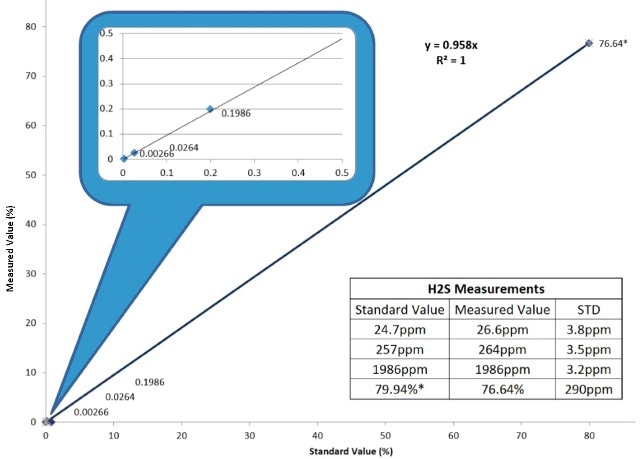
Figure 2. H2S measurements recorded on the MAX300-IG.
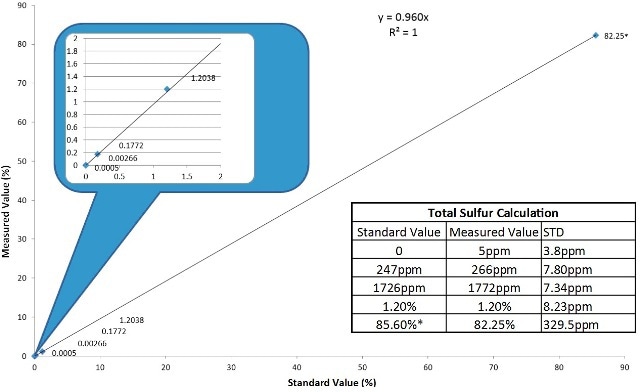
Figure 3. The Total Sulfur measurement as recorded on the MAX300-IG.
The mass spectrometer employed a single point calibration which was recorded on the 1986ppm standard. It provided a speciated analysis for each sulfur component in the sample, and provides real-time calculation of total sulfur for reporting purposes. The dynamic range of the analyzer for all components is linear up to 100%.
The linearity of the MAX300-IG on the hydrogen sulfide in the sample ensures the accuracy of the single-point calibration across the entire dynamic range of the mass spectrometer. In addition, it facilitates an alternative validation procedure for hydrogen sulfide measurement by means of a low-level sulfur standard rather than expensive, unsafe, high-percent hydrogen sulfide blends.
Real-time Measurement of Total Sulfur and High Heating Value
As per 40 CFR 60 subpart Ja, total sulfur values need to be recorded and reported to the EPA in the event of discharge exceeding a stipulated limit, and the root-cause analysis of such discharge events needs to be performed. This can be done with the full, speciated analysis of each hydrocarbon and sulfur component, as a spike of a specific chemical is useful to determine the source of the emission and to facilitate reporting.
The MAX300-IG can also quantify the presence of non-sulfur components in a flare stream. It's highly accurate measurements of non-sulfur components help reporting BTU values with precision and reproducibility (Table 1). The instrument performs the real-time calculation and reporting of the BTU values to the plant control system, and records the speciated concentrations of each hydrocarbon. Monitoring each component across the full dynamic range (up to 100%) in the event of a release is crucial aspect for root-cause analysis.
Table 1. Speciated hydrocarbon measurements and calculated stream high heating value (HHV).
| Component |
Measured Concentration |
STD (ppm) |
| Hydrogen |
16.360% |
850 |
| Methane |
78.990% |
840 |
| Nitrogen |
0.380% |
62.7 |
| Propane |
0.811% |
61.2 |
| Ethane |
0.016% |
49.5 |
| Propylene |
0.126% |
19.7 |
| Isobutane |
0.276% |
30.7 |
| Carbon Dioxide |
0.751% |
25.98 |
| 1-Butene |
0.097% |
19.9 |
| N-Butane |
0.437% |
37.4 |
| Heptane |
0.018% |
3.47 |
| Pentane |
0.148% |
19.5 |
| Hexane |
0.014% |
11.1 |
| HHV |
936.34 BTU |
0.58 BTU |
HHV= ((%H2x324.35)+(%CH4x1010.25)+(%C2H4x1600.72)+(%C2H6x1769.79)+(% C3 H6x2335)+(%C3 H8x2518.7)+(%C4 H8x3082.33)+(%IsoC4 H10x3254.53)+(%NC4 H10x3264)+(%C5 H12x4011.61)+ (%C6 H14x4758.72)+(%C7 H16x5505.99))/100
Instrument Range and Linearity Independent of Component
The MAX300-IG was integrated to a sample system consisting of a blend of hydrogen and carbon dioxide to demonstrate its entire dynamic range, and its linearity of response to different compounds. Here, H2S and CO2 were measured from 0-100% by altering the sample composition subsequent to a a single-point calibration (Figure 4).
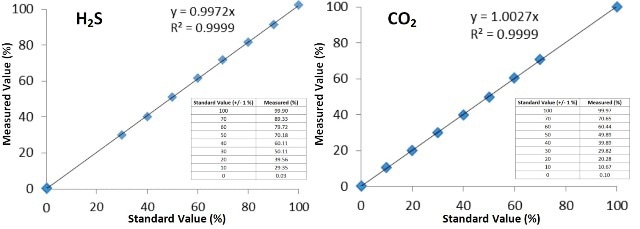
Figure 4. Full-scale linearity of hydrogen sulfide and carbon dioxide
In this flare gas application, the same equipment was used by the MAX300-IG for the analysis of each component as it has only one sample path. Moreover, the physics of ion trajectories forms the basis of the separation principle in the case of a mass spectrometer. Hence, the accuracy and linearity of the mass spectrometer is independent of compound identity; this validates the instrument across the entire range by means of any high concentration standard, irrespective of chemical composition.
Dangerous high-concentration sulfur standards are normally used to validate compliance with regulations such as subpart Ja. However, validations can be done at the high range using safe-to-handle gases such as argon, nitrogen and carbon dioxide, thanks to the separation principle of the mass spectrometer. This allows the flare CEMS system to be installed and operated safely and cost effectively.
Sulfur Analysis Response Time and Hysteresis
The timely response of the instrument to stream changes is crucial in dynamic sample analysis. Hysteresis and clearing are the major problems while handling compounds such as H2S due to their reactivity with steel surfaces. The MAX300 is designed for the analysis of flares containing sulfur, and uses sulfur specific components for the sample path’s wetted surfaces. Figure 5 shows the fast response of the analyzer to a change from a 100% H2S sample to a 100% CO2 sample (<10 seconds).
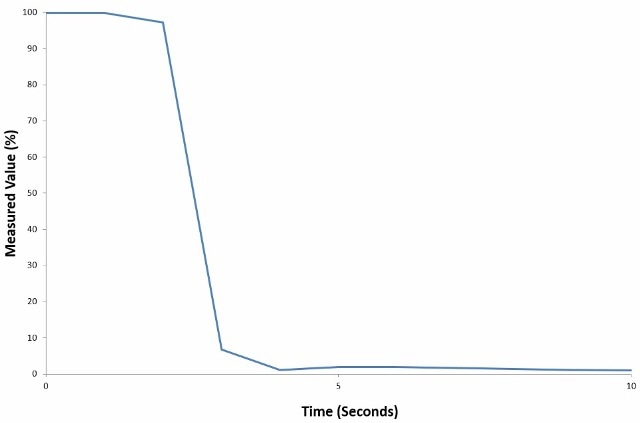
Figure 5. Clearing time 100% to 0% H2S. The calculated T90 was less than 3 seconds. At an analysis rate of 1 second per update, the 3rd update reported 6.7% H2S.
Since subpart Ja has mandated total sulfur measurement within the 0-300ppm analysis range, even slight hysteresis in the instrument can affect the measurement accuracy significantly. Here, the nitrogen gas was used to dilute a sulfur blend to record the decreasing sulfur concentrations at different levels from 0 to 300ppm. Then, increasing sulfur concentrations were recorded by reducing the nitrogen flow. The results shown in Figure 6 illustrate the lack of hysteresis, and the true linearity of the MAX300 measurements of both H2S and Total Sulfur.
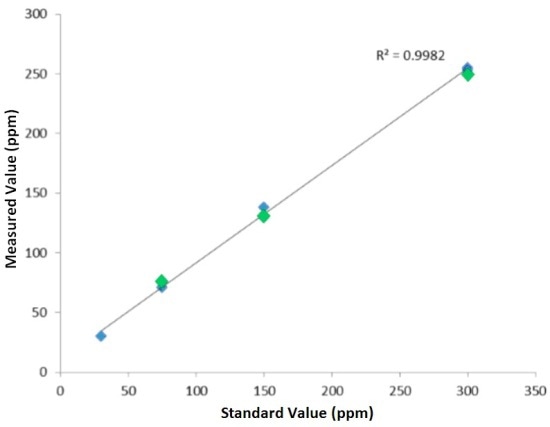
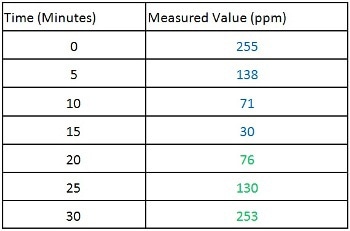
Figure 6. Hydrogen sulfide measurements recorded in a diluted sulfur blend. Following each change of the dilution ratio data was recorded for five minutes.
Conclusion
The MAX300-IG can measure hydrogen sulfide, BTU content and Total Sulfur in flare gas simultaneously, offering the dynamic response, dynamic range, and speed of analysis demanded by regulations such as subpart Ja.
In addition, the mass spectrometer is capable of monitoring more than one flare without compromising the 15-minute reporting cycle. It can measure percent to ppb level changes, and is highly sensitive to varying sample compositions. Further, speciation of all compounds delivers essential data for root-cause analysis and the linearity of the MAX300-IG allows for two alternative validation strategies to reduce the risk by avoiding the use of unsafe and expensive high- concentration H2S standards.

This information has been sourced, reviewed and adapted from materials provided by Process Insights - Mass Spectrometry.
For more information on this source, please visit Process Insights – Mass Spectrometers.