Raman technology has been deployed as a molecular fingerprint for the analysis of molecular structures, for predicting the chemical concentrations in mixtures and for identifying specific molecules.
Raman spectroscopy has truly become a widely accepted method for practical, real-world applications due to its non-destructive nature, no need for sample preparation and the advent of portable Raman systems. Raman has become very popular in chemical companies, pharmaceuticals and safety and security agents globally for applications such as quick identification of strange chemical compounds, quantitative analysis and mixture identification in mixtures and raw material verification. Also, the peak intensity ratio between two Raman signature peaks can also offer useful data on phase transition, material crystallinity and material structure disorder.
Portable Raman for at-line characterization of carbon black is explored in this article. Since distinctive data is available in the peak ratio between the D-band and G-band of sp2 carbon material, Raman spectroscopic analysis is highly suitable for characterizing carbon black material. The versatility of Raman spectroscopy is showcased by the portable Raman spectrometer used in this study and it also reveals the effect the latest range of portable Raman spectrometers will have to different industries.
Carbon Black Materials
Carbon black material is graphite in an amorphous structure, with a lower level of crystallinity than graphite. It is used primarily as reinforcing filler in automobile tires and other rubber products and also in paint, pigments and carbon paper. Since the material structure is highly complex and there are no definite standard test methods, material characterization is restricted to traditional tests such as iodine adsorption numbers for studying carbon black grades, particle size determination from surface area values, and dibutyl phthalate (DBP) absorption numbers for measuring the relative amount of oil that can be absorbed by carbon black.
X-ray diffraction analysis or high performance imaging analysis are capable of revealing the carbon black material structure at the atomic level however these methods do not enable on-line or at-line real time testing at the molecular level. That kind of real-time testing alone is useful for evaluating, controlling and monitoring the carbon black manufacturing process.
Raman is highly suitable for analyzing carbon materials in various crystal structures since the carbon microstructure is highly Raman active.
Graphite includes hexagonal carbon atom planes with four carbon atoms in a single unit cell. The connection of the different planes is done with rotations or translations round the symmetry axis. For the single crystal graphite symmetric group D4h, one of the vibrational modes E2g is highly Raman active and is related to a Raman peak at 1582cm-1 (G-band).
Consequently, graphite having very high single crystallinity, known as Highly Ordered Pyrolytic Graphite (HOPG), shows a Raman peak at 1582cm-1. Figure 1 shows the E2g mode graphite structure related to the G-band. Carbon back material has a amorphous microcrystalline structure and will reveal another peak at around 1350cm-1 (D-band).
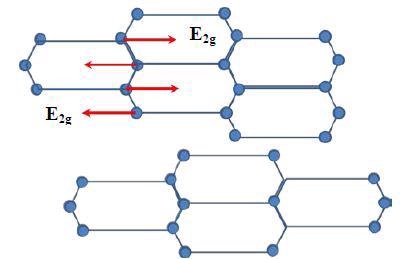
Figure 1. E2g vibrational mode of carbon atoms in one graphite layer
The structure disorder close to the microcrystalline structure destroys the symmetry structure, which is shown by the peak at 1350cm-1. The degree of disorder of the graphite materials is characterized by the Raman peak intensity ratio of ID/IG. According to the researchers, ID/IG is inversely proportional to the carbon black material grain size for grain sizes higher than 2nm.
The Raman spectra of three different carbon black samples with the distinct D-band and G-band, obtained using the portable Raman spectrometer i-Raman Plus with 532nm laser excitation is shown in Figure 2.
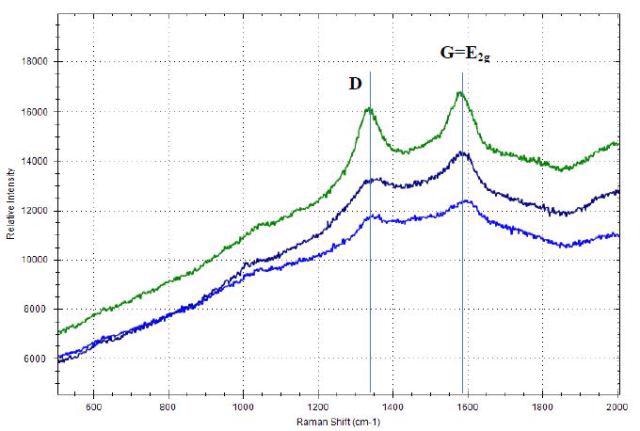
Figure 2. Raman spectra of carbon black materials with D-band and G- band
Experimental Procedure
Commercially available carbon black materials were characterized using B&W Tek's portable Raman spectrometer, i-Raman Plus® with a 532nm laser excitation and spectral resolution at 4.5cm- 1.
For ensuring a precise laser focus on the sample surface, a portable video microscope sampling system combined with the portable i-Raman Plus system is used. The experimental setup is shown in Figure 3.
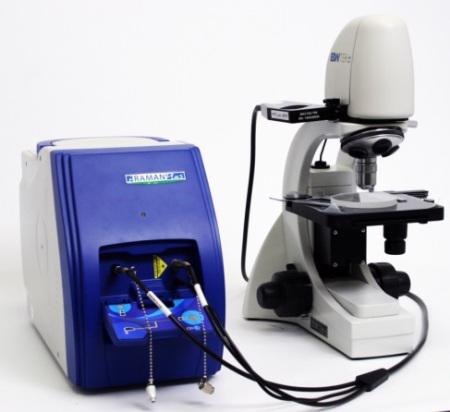
Figure 3. Experiment setup
The laser power was set at around 40mW and with an integration time of 120s, Raman spectra were obtained at room temperature. It is essential that the dark noise and the readout noise for the CCD detector in a Raman spectrometer are very low with regards to the Raman signal due to the low efficiency of the Raman phenomenon (10-8).
The i-Raman Plus uses a back- thinned CCD detector with TE-cooling to -2°C. In comparison with a traditional front illuminated CCD with quantum efficiency around 50%, the quantum efficiency of the back-thinned CCD can reach up to 90% with photons entering from the rear side of the CCD where the Si substrate is etched thin for improving how much light reaches the CCD active area. This can significantly improve the quantum efficiency by minimizing the photon loss. The CCD device’ TE-cooling considerably minimizes the dark noise and for each 7°C decrease in device temperature, the dark noise reduces by 50%.
The cooled detector allows for long integration time, such as the 120 seconds in the experiments in this study. This considerably improves the detection limit and makes low-light level applications possible.
The BWSpec™ software was utilized for data analysis, which includes peak analysis and baseline correction. Any fluorescence accompanying the Raman signal can be eliminated by the software’s baseline correction function. This function is based on an innovative algorithm adaptive iteratively reweighted Penalized Least Squares (airPLS).
Using the airPLS algorithm, weights of sum squares errors (SSE) are iteratively changed between the fitted baseline and original signals, while the weights of the SSE are adapted using the difference between the previously fitted baseline and the original signals.
The Raman spectrum of carbon black prior and subsequent to the airPLS baseline correction is shown in Figure 4. Following the baseline correction, the Raman peak intensities can be obtained using the peak analysis function of the software. It is then possible to compute the Raman peak intensity ratio of the D-band and G-band.
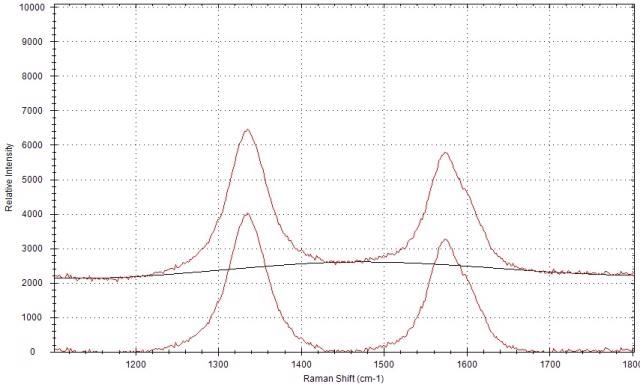
Figure 4. Raman spectrum of carbon black before and after the baseline correction
The Raman spectra of the three carbon black materials following baseline correction are shown in Figure 5. The G-band and D-band peak positions, peak ratio ID/IG of three samples and peak intensities are computed and shown in Table 1.
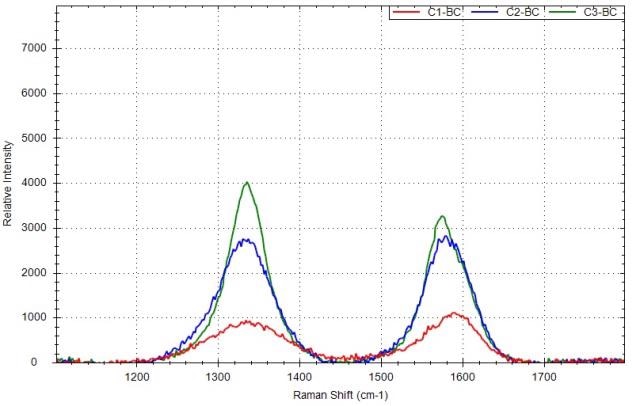
Figure 5. Raman spectra of carbon black samples after the baseline correction with different ID/IG: red is for C1, blue is for C2, green is for C3.
The D-band position is dependent on the excitation laser wavelength. It was observed that when the laser excitation shifted from 488 to 647nm, the D-band peak position changed from 1360 to 1330cm- 1.
As shown in the experiment, the D-band peak position is around 1337cm-1 at 532nm laser excitation. The ID/IG ratios are below one for C1 and C2, showing that there is some degree of disorder in these carbon black materials, which is in the range of graphite (C1) and graphite powder(C2). For sample C3, the ID/IG ratio is higher than one, showing that the sample has a higher degree of disorder.
Table 1. Peak info of the D-band and G-band for three carbon black samples with 532nm laser excitation
| Sample |
D (cm-1) |
G (cm-1) |
ID |
IG |
Peak Ratio ID/IG |
| C1 |
1337 |
1586 |
909.4 |
1120.5 |
0.81 |
| C2 |
1337 |
1581 |
2763.1 |
2828.1 |
0.98 |
| C3 |
1336 |
1574 |
4022.5 |
3263.2 |
1.23 |
Conclusions
The increased sensitivity of the Raman spectrometer offers a quality spectrum of carbon black materials with unique D- bands and G-bands. It is possible to establish a correlation between the Raman spectra and the structure. The G-band signifies the level of order of graphite in its single crystalline form.
A D-band being present is associated with the disorder level of the crystal structure with a lower symmetry of the sp2 carbon. The ID/IG ratio can be used for characterizing carbon black in different aspects such as
- The degree of disorder of carbon black
- Estimation of the grain size of the carbon black materials
- Batch uniformity when multiple measurements are obtained at different locations of the materials
Since portable Raman spectrometers are capable of a quality spectrum, at-line or on-line analysis of carbon black materials is possible. This is advantageous for carbon black manufacturing for process monitoring and process control. In comparison with large bench-top labgrade Raman spectrometers that cannot be arranged on-line or at-line for real time analysis, the latest generation portable Raman spectrometers have shown significant potential in industrial applications and will play a very significant role in the near future.

This information has been sourced, reviewed and adapted from materials provided by B&W Tek.
For more information on this source, please visit B&W Tek.