Raman spectroscopy is a molecular spectroscopy, which is observed as inelastically scattered light and enables the interrogation and identification of vibrational (phonon) states of molecules. Therefore, Raman spectroscopy provides an invaluable analytical tool for molecular finger printing and for monitoring changes in molecular bond structure, for example, state changes and stresses and strains.
Raman spectroscopy has several major advantages over vibrational spectroscopy techniques, such as FT-IR and NIR. These advantages stem from the fact that the Raman effect manifests itself in the light scattered off of a sample as opposed to the light absorbed by a sample.
Therefore, Raman spectroscopy is insensitive to aqueous absorption bands and requires little to no sample preparation. This characteristic of Raman spectroscopy enables the measurement of gases, liquids, and solids not only directly, but also through transparent containers such as plastic, glass, and quartz.
Similar to FT-IR, Raman is highly selective, allowing it to detect and distinguish between molecules and chemical species that are very similar. Figure 1 illustrates an example of five similar molecules - ethanol, acetone, ethyl acetate, tolune, and dimethyl sulfoxide.
Although the molecular structure of these chemicals is similar, their Raman spectra are clearly differentiable, even to the untrained eye. With Raman spectral libraries, it is easy to see how easily material identification and verification can be performed using Raman spectra.
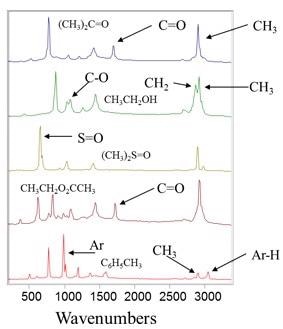
Figure 1. Example Raman spectra of various molecules
Theory of Raman Scattering
When considering Raman scattering, the physics can be thought about in one of two ways: the classical wave interpretation or the quantum particle interpretation. In the classical wave interpretation, light is considered as electromagnetic radiation, which consists of an oscillating electric field that interacts with a molecule through its polarizability.
Polarizability is measured by the ability of an electron cloud to interact with an electric field. For example, soft molecules such as benzene have the tendency to be strong Raman scatterers, whereas harder molecules like water tend to be fairly weak Raman scatterers.
When considering the quantum particle interpretation, light is considered a photon, which strikes the molecule and then inelasticaly scatters. In this interpretation, the number of scattered photons is proportional to the size of the bond. For instance, molecules with large Pi bonds such as benzene have the tendency to scatter lots of photons, while water with small single bonds is often a very weak Raman scatterer. Figure 2 illustrates a visual comparison of the two methods.
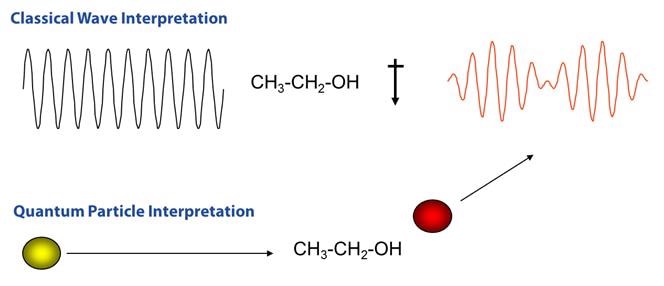
Figure 2. Comparison of Raman scattering interpretations
When deriving the Raman effect, it is often easiest to start with the classical interpretation by considering a simple diatomic molecule as a mass on a spring (Figure 3), where m is the atomic mass, x is the displacement, and K is the bond strength.
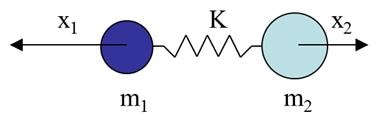
Figure 3. Diatomic molecule as a mass on a spring
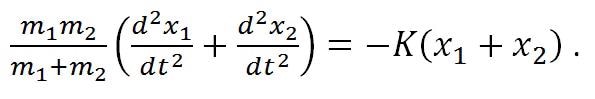
When using this approximation, the displacement of the molecule can be expressed by using Hooke’s law as,
 |
Equation (1) |
By replacing the reduced mass (m1m2/[m1+m2]) with µ and the total displacement (x1+x2) with q, the equation can be expressed as,
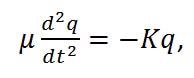 |
Equation (2) |
By solving Equation 2 for q we get,
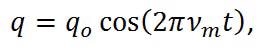 |
Equation (3) |
where νm represents the molecular vibration and is defined as,
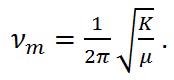 |
Equation (4) |
From Equations 3 and 4, it is apparent that the molecule vibrates in a cosine pattern with a frequency proportional to the bond strength and inversely proportional to the reduced mass. From this we can see that each molecule will have its own unique vibrational signatures, which are determined not only by the atoms in the molecule, but also the characteristics of the individual bonds.
Through the Raman effect, these vibrational frequencies can be measured due to the fact that the polarizability of a molecule, α, is a function of displacement, q. When incident light interacts with a molecule, it induces a dipole moment, P, equal to that of the product of the polarizability of the molecule and the electric field of the incident light source. This can be expressed as,
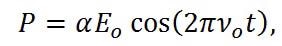 |
Equation (5) |
where Eo is the intensity and νo is the frequency of the electric field. Using the small amplitude approximation, the polarizability can be described as a linear function of displacement,
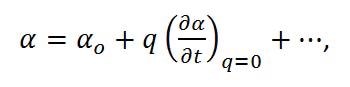 |
Equation (6) |
which when combined with Equations 3 and 5 results in,
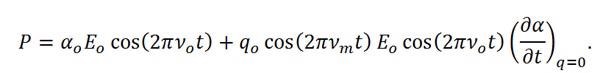 |
Equation (7) |
In Equation 7 we see that there are two resulting effects from the interaction of the molecule and the incident light. The first effect is called Rayleigh scattering, which is the dominate effect and results in no change in the frequency of the incident light. The second effect is the Raman scattered component and when expanded to,
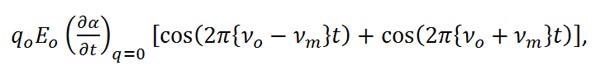 |
Equation (8) |
can be shown to shift the frequency of the incident light by plus or minus the frequency of the molecular vibration. The increase in frequency is known as an Anti-Stokes shift and the decrease in frequency is known as a Stokes shift.
By measuring the change in frequency from the incident light (typically only the Stokes shift is used for this measurement) the Raman effect now gives spectroscopists a way of directly measuring the vibrational frequency of a molecular bond.
Now that we have derived the Raman effect using the classical wave interpretation, we can use the quantum particle interpretation to better visualize the process and determine additional information. As discussed earlier in the quantum interpretation, the Raman effect is described as inelastic scattering of a photon off of a molecular bond. From the Jablonski diagram shown in Figure 4, we can see that this results from the incident photon exciting the molecule into a virtual energy state.
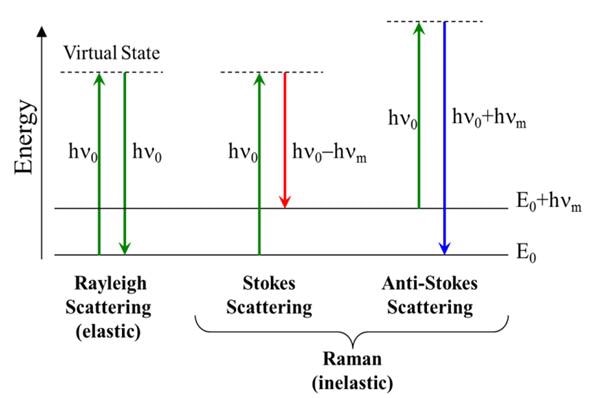
Figure 4. Jablonski Diagram Representing Quantum Energy Transitions for Rayleigh and Raman Scattering
When this occurs, there are three different potential outcomes. First, the molecule can relax back down to the ground state and emit a photon of equal energy to that of the incident photon; this is an elastic process and is again called Rayleigh scattering.
Second, the molecule can relax to a real phonon state and emit a photon with less energy than the incident photon; this is known as Stokes shifted Raman scattering. The third potential outcome is that the molecule, which is already in an excited phonon state, is excited to a higher virtual state, and it then relaxes back down to the ground state, emitting a photon with more energy than the incident photon; this is known as Anti-Stokes Raman scattering.
As most molecules will be found in the ground state at room temperature, there is a much lower probability that a photon will be Anti-Stokes scattered. Therefore, most Raman measurements are carried out considering only the Stokes shifted light.
Further investigation of the quantum interpretation of the Raman effect, can show that the power of the scattered light, Ps, is equal to the product of the intensity of the incident photons, Io, and a value called the Raman cross-section, σR. It can be shown that,
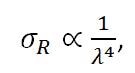 |
Equation (9) |
Where, λ equals the wavelength of the incident photon. Therefore,
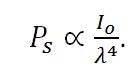 |
Equation (10) |
From Equation 10, it is clear that a linear relationship exists between the intensity of the incident light and the power of the scattered light, and also a relationship between the power of the scattered light and the inverse of the wavelength to the fourth power. Therefore, it is always desirable to use a high power excitation source and a short excitation wavelength based on these relationships. However, this is not always the case, as we will see in the following section.
Components of a Raman Spectrometer
In any Raman spectrometer, there are three main components - a sampling apparatus, an excitation source, and a detector. Although these components have come in varying forms over the years, advanced Raman instruments were developed using a laser as an excitation source, a spectrometer for the detector, and a fiber optic or a microscope for the sampling apparatus.
Raman spectroscopy is predicated on the ability to measure a shift in wavelength (or frequency) and, therefore, a monochromatic excitation source should be used. While a laser is usually the best excitation source, not all lasers can be used for Raman spectroscopy, so the laser frequency should be very stable and should not mode hop, as this will lead to errors in the Raman shift.
Also, a clean, narrow bandwidth laser should be used because the quality of the Raman peaks is directly influenced by the stability and sharpness of the excitation light source.
Wavelength is the final consideration when deciding which laser to use for a Raman spectrometer. From the previous section, it is clear that when the wavelength is shorter, the Raman signal becomes more powerful. However, as stated before, this is not the only consideration, particularly when it comes to dealing with organic molecules.
When excited by high energy (short wavelength) photons, most organic molecules will tend to fluoresce. Although fluorescence is usually considered to be a low light level process, it can still overwhelm the signal in the Raman spectrum (Figure 5). This is because the Raman effect contains a very small fraction (approximately 1 in 107) of the incident photons. Therefore, only visible lasers are used for inorganic materials such as carbon nanotubes.
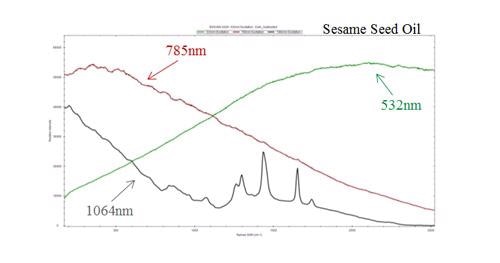
Figure 5. Comparison of Raman spectrum at varying excitation wavelengths demonstrating fluorescence interference
In the case of organic molecules, laser wavelength should be shifted into the near infrared to reduce fluorescence without exceeding the CCD spectral detection limits. 785 nm diode lasers have become the industry standard because of their availability and the fact that they enable maximum fluorescence reduction without affecting the spectral range or resolution. A 532 nm laser is the best choice for increased sensitivity with inorganic molecules, as fluorescence is no longer an issue.
As discussed before, Raman scattering is extremely weak and needs long integration times to collect enough photons to measure a discernible signal. This makes it essential to use a TE cooled spectrometer to reduce the dark noise.
For weak Raman scatters or very low concentrations, a back-thinned CCD may be required to further increase the spectrometer‘s sensitivity. By etching the detector to just a few microns thick, the probability of an electron being reabsorbed as it travels through the detector based on Beer’s law is considerably reduced. This boosts the detector’s sensitivity from a maximum quantum efficiency of 35% to more than 90%.
Due to the highly selective nature of Raman spectra, they may include closely spaced peaks that may need to be resolved depending on the application. This can be achieved using a high resolution spectrometer. Usually, standard spectrometer configurations are meant for 785 nm and 532 nm laser excitation wavelengths, but custom excitation wavelengths are also available.
These spectrometers can provide a range of configurations that are exclusively designed for high resolution and wide spectral range. Standard spectral ranges are available from as low as 65 cm-1 (filter dependent) to as high as 4000 cm-1, with a spectral resolution as fine as 3 cm-1.
Whenever a sample is measured, the only effective way of directing the laser light to the sample, collecting the Raman scatter, and directing it to a spectrometer is to use a fiber optic probe. A Raman probe must be able to direct and focus the monochromatic excitation source (usually a laser) to the sample, collecting the scattered light, and then directing it to the spectrometer. A typical design for a Raman probe is shown in Figure 6.
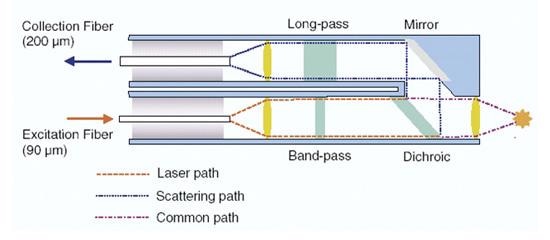
Figure 6. Typical design of a Raman probe
Given that a pure signal is very important to Raman spectroscopy, a narrow band-pass filter is placed in the optical path of the excitation source before it reaches the sample. As the Raman effect is very weak, the signal should be collected at a 0° angle normal to the sample. This results in interference from Rayleigh scattering, and therefore the collected signal should be filtered through a long pass filter before it is directed to the spectrometer.
The flexibility of fiber optics allows the probe to be taken to a solid sample and also enables it to be immersed in slurries or liquids in both process and lab environments (for kinetic measurements in real time). Fiber optics can also be coupled to cuvette holders, microscopes, and a host of sampling accessories.

This information has been sourced, reviewed and adapted from materials provided by B&W Tek.
For more information on this source, please visit B&W Tek.