Carbon nanomaterials consist of a range of carbon allotropes including carbon nanofibers, carbon nanotubes, graphene, and graphene oxide, each displaying unique properties in mechanical strengths, electrical conductivity, and thermal conductivity due to the distinctive structures of each allotrope. Graphene is a 2D material created from a hexagonal lattice of carbon atoms. Graphite is composed of individual stacked layers of graphene.
The superconductivity, excellent heat conductivity, and strength make graphene an extremely attractive material as a conductor in batteries and in memory chips [1]. Graphene oxide is an alternative form of graphene and it can be employed to desalinate water and eliminate radioactive isotopes because of its permissibility of water [2]. Carbon nanotubes are tubes with walls produced from graphene sheets and they have attracted a great deal of interest from industry to potentially produce high surface area catalysts in fuel cells by adding different functional groups [3]. Carbon nanotubes can be either single-walled (SWNT) or multi-walled (MWNT). Carbon nanofiber is a combination of carbon nanotubes and carbon black, and it has found application in construction materials because of its flexibility and durability [4].
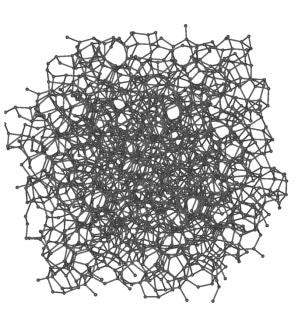
Carbon black (amorphous)
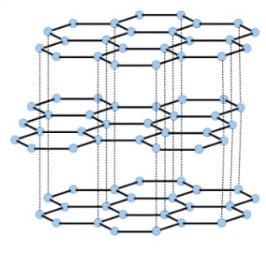
Graphite
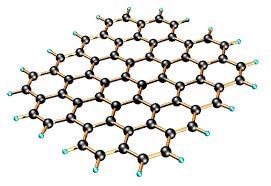
Monolayer graphene
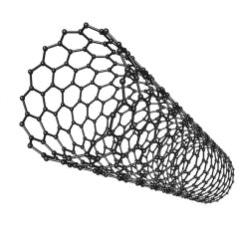
Carbon nanotube
Since its discovery in 2004, graphene has been widely heralded as a “wonder material” and now it has entered the era of industrial manufacturing. The 2016 Deloitte global prediction report on the graphene industry predicted the global graphene market’s value to be only in the low tens of millions of dollars [5], but the amount currently spent on research and development of graphene is likely to be in the hundreds of millions of dollars. It may even be decades before the potential of these carbon nanomaterials is completely accomplished; however, in the medium term, graphene may be integrated into products worth billions of dollars.
Graphene can be produced through different processes [6]: 1) mechanical exfoliation, which is generally performed on a smaller scale; 2) chemical vapor deposition (CVD), which is done on a comparatively larger scale but with expensive equipment at a high cost; and 3) exfoliation and reduction of graphene oxide, which is produced through the oxidation of graphite powder on a larger scale but can lead to extensive defects. For manufacturing graphene in a large scale, one vital question remains: how to quickly and easily characterize the quality of graphene and other carbon nanomaterials in order to monitor and control the manufacturing process.
In recent years, Raman spectroscopy has been widely used by carbon nanomaterials research communities' due to its ability to characterize materials from molecular vibrations. The Raman spectra of carbon nanomaterials are generally characterized by three main bands: The D-band, the G-band, and the 2D-band (also called the G'-band). Although simple, the spectra of these nanomaterials have information about their micro-structures and their quality as revealed by the peak shapes, peak positions, add peak intensities. The G-band appearing around 1582 cm-1 represents the graphene in-plane sp2 vibrational mode and it is a sign of the crystallinity of the material. The dispersion of the G-band can be seen in disordered graphene materials, and the dispersion is proportional to the level of disorder. The D-band at around 1350 cm-1 is due to the structural disorder close to the edge of the microcrystalline structure that reduces the symmetry of the structure. The Raman peak intensity ratio of the two bands, ID/IG, can be employed to characterize the level of disorder of the materials [7]. The 2D-band appearing around 2700 cm-1 depends on the laser excitation wavelength and is connected to the number of graphene layers [3].
Figure 1 displays the Raman spectra of monolayer graphene (red trace), single crystal graphite (green trace), carbon nanotubes (black trace), and carbon black powder (blue trace). The sharp, symmetric single peak of 2D-band characterizes the graphene. The graphite spectrum exhibits a high level of order and thus crystallinity characterized by its famous G-band and the absence of a D-band. Since graphite is made up of several layers of monolayer graphene, the 2D-band seen in the graphite spectrum is much larger and asymmetric compared to the graphene 2D-band, signifying multiple components from a number of phonon modes. Carbon nanotubes exhibit unique features of G-band. Due to the curvature and confinement of graphene layers in forming nanotubes, the G-band turn out to be asymmetric for MWNT and more likely separates into two bands – the G-band and the G+ for SWNT [7]. The spectrum of carbon black, which contains the lowest level of crystallinity, exhibits a strong D band and broad G band, having a high ID/IG ratio, signifying a disordered structure.
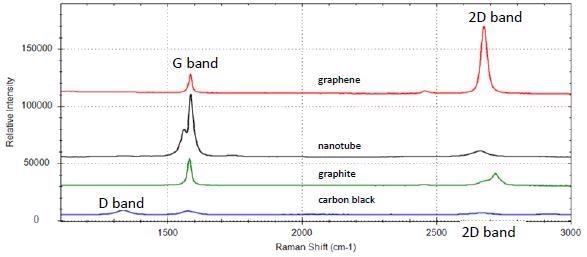
Figure 1. Raman spectrum of graphene (red), carbon nanotubes (black), graphite (green), and carbon black (blue)
Raman spectroscopy offers complete information about the characteristics of graphene, graphite, carbon black, and other carbon nanomaterials. Even though confocal Raman microscopy can offer high-resolution characterization of carbon nanomaterials, the high cost of this instrumentation combined with the data interpretation and complexity in operation is inadequate for monitoring in a large-scale production environment, where quick and simple analytical tools are necessary. A high-throughput portable Raman analyzer is employed in this study to characterize three kinds of materials: carbon nanofibers, carbon black, and graphene powder coated sheets. This rapid analysis can be used as an on-line or at-line method for graphene and other carbon nanomaterials for process monitoring, materials characterization, and product quality control.
Experimental
The high-throughput B&W Tek’s i-Raman® Pro HT (Figure 2) with a laser excitation of 532 nm through a fiber-optic sampling probe was employed for measurements of all samples. This i-Raman Pro HT utilizes a high-throughput Raman spectrometer with a back-thinned CCD TE-cooled to -25 °C. No microscope is required for materials in powdered forms. A probe holder with an adjustable xyz stage was employed to support the fiber-optic probe over an aluminum pan that contains a given carbon sample. The z-focus was employed to improve the working distance from the probe to the sample.
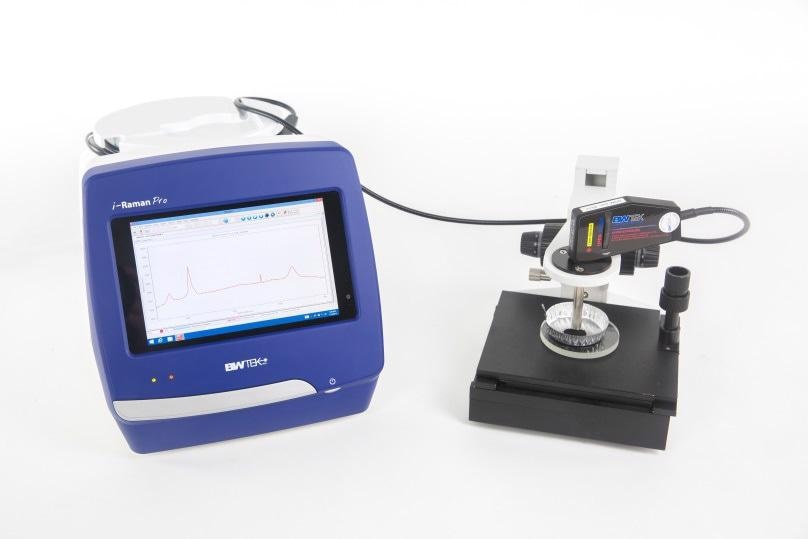
Figure 2. i-Raman Pro HT setup for analysis of carbon nanomaterials (enclosure not included)
BWSpec software was employed for programming the calculation of peak intensities and ratios, data collection, and spectral processing. BWSpec enables the user to configure analysis parameters and perform on-line experiments in real-time. It is also possible to perform off-line batch processing. The software can calculate and monitor up to six variables, with results exhibited in a control chart and tabulated simultaneously.
The i-Raman Pro HT was used to analyze three types of carbon nanomaterials: sheets coated with graphene powders, carbon black powders, and carbon nanofibers. Laser power of 35 mW with an integration time of 60 seconds was used to acquire Raman spectra for all sheets coated with graphene powders. An integration time of 90 seconds was used with a laser power of ~21 mW for carbon black powder and carbon nanofiber samples. For each sample, three spectra were collected. An adaptive iteratively reweighted Penalized Least Squares (airPLS) background correction was used for all collected spectra in order to eliminate any fluorescent background present in the spectra. In addition, Savitzky-Golay smoothing algorithm with a window size of 2 was applied to all spectra.
Test Results
Graphene Powders
Six sheets coated with graphene powders were analyzed. The manually offset representative spectra for all graphene samples are shown in Figure 3. The D-band, 2D-band, and G-band can be seen from all sample spectra. Graphene #6 presents the weakest 2D-band and the most intense D-band, in addition to a prominent D' band at 1620 cm-1 that is consistent with defected graphene [8]. A small shift in the position of the G-band is also found. This information points out that graphene #6 has the highest disorder and so the least graphene characteristics among all the samples.
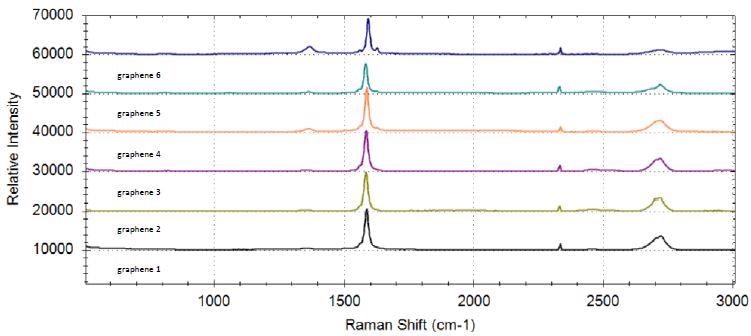
Figure 3. Raman spectra of six graphene samples
BWSpec software was programmed in such a way that it can automatically calculate the ID/IG value for each measurement. The calculated peak intensities and intensity ratios for the G- and D-bands are presented in Table 1.
Table 1. Calculation of the D-band height, G-band height, and ID/IG for all graphene samples
| Sample |
ID |
IG |
ID/IG |
| 1 |
216.2524 |
2851.3339 |
0.0758 |
| 2 |
184.2049 |
2898.9823 |
0.0635 |
| 3 |
210.1374 |
3067.5027 |
0.0685 |
| 4 |
449.2745 |
2987.0646 |
0.1504 |
| 5 |
188.0537 |
2101.317 |
0.0895 |
| 6 |
957.5563 |
2052.6019 |
0.4665 |
G-band dispersion is seen among the graphene samples with graphene #4 and graphene #5 exhibiting noticeable difference from each other (Figure 4) with calculated G-band full width at half maximum (FWHM) for sample #4 and #5 shown. As illustrated in Figure 5, all of the 2D-bands from the samples are asymmetric, a characteristic of graphene powder. Some vital differences in the intensity and shape among all 2D-bands can be observed. Graphene #5 has the most defined 2D-band. This further shows that graphene #5, similarly to #1, #2, and #3 samples, has a high level of crystallinity, fewer layers of graphene, and less disorder.
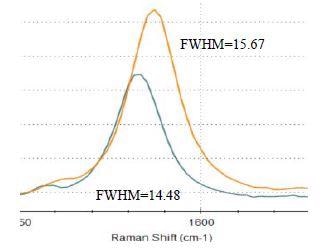
Figure 4. G-band for graphene #4 (orange) and #5 (green) with labelled FWHMs
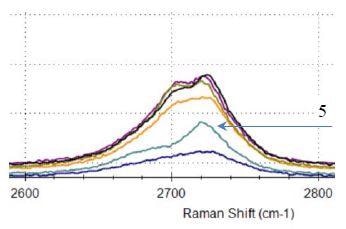
Figure 5. 2D band for graphene samples #1 to #6
Carbon Nanofibers and Carbon Black
Four carbon black samples and two carbon nanofiber samples were analyzed. For each sample, three spectra were collected. The manually offset representative spectra for each sample are shown in Figure 6. The four carbon black samples exhibit typical carbon black Raman signatures that contain G- and D-bands but not 2D-band. The two carbon nanofiber samples exhibit prominent D-bands, demonstrating a high level of disorder. The G-bands in the carbon nanofiber spectra also display some asymmetry, which could come from the nanotubes through slight splitting of the G-band caused by curvature of graphene layers when forming the nanotubes.
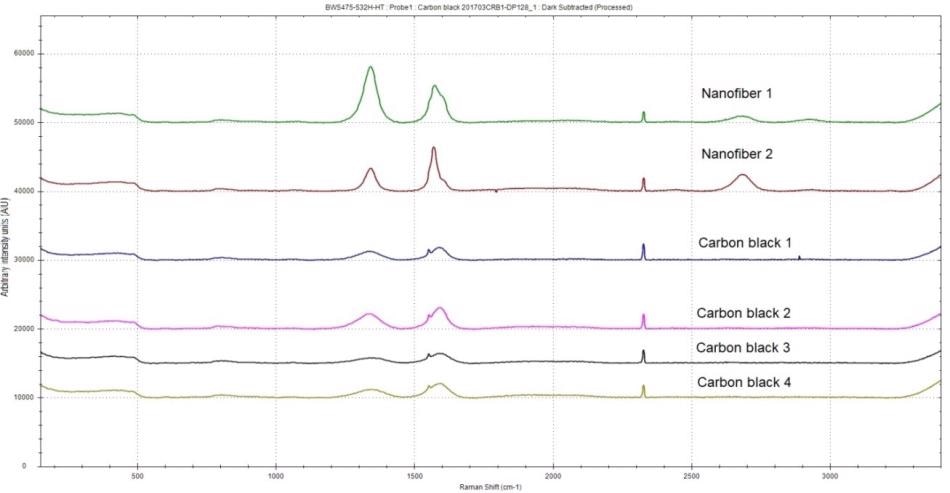
Figure 6. Raman spectrum of two carbon nanofiber samples and four carbon black samples
BWSpec software was employed to automatically calculate the ID/IG values as spectra were gathered. The calculated ID/IG peak intensity ratios measured for the two carbon nanofiber samples and four carbon black samples are presented in Table 2. With an average ID/IG of 0.4706, the carbon nanofiber sample #2 has the highest degree of order of all samples, whereas the carbon nanofiber sample #1 has a particularly high level of disorder with an average ID/IG of 1.3654.
Table 2. Average calculated peak intensity ratios for D-band and G-band
| Carbon type |
Average peak ratio (n=3) |
| Carbon black 1 |
0.7667 |
| Carbon black 2 |
0.7294 |
| Carbon black 3 |
0.5557 |
| Carbon black 4 |
0.5745 |
| Carbon nanofiber 1 |
1.3654 |
| Carbon nanofiber 2 |
0.4706 |
It is worth noting that the Raman spectra acquired for two carbon black samples (Figure 7) show two peaks at ~ 213 cm-1 and 280 cm-1 that are consistent with Fe2O3 hematite. It is a well-known fact that there can be up to 10% of residual iron content in the nanofiber samples from the manufacturing process. The presence of iron oxide is distinctively confirmed by the two hematite bands.
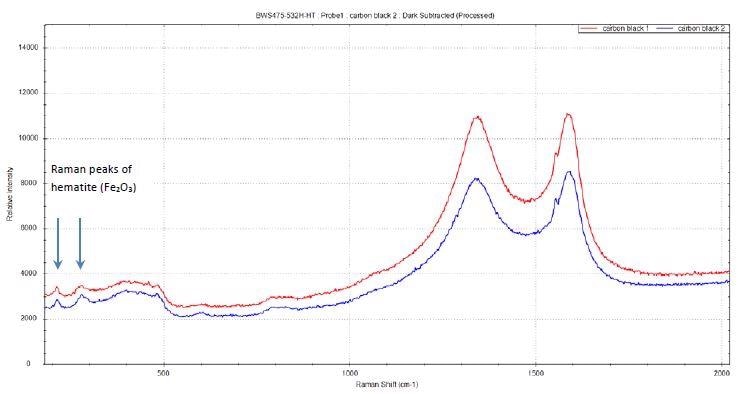
Figure 7. Raman peaks of hematite Fe2O3
Conclusions
Albeit simple, a Raman spectrum of a carbon nanomaterial can offer a huge amount of information to characterize materials including graphene, carbon nanotubes, graphite, and carbon black. The i-Raman Pro HT from B&W Tek can rapidly characterize carbon nanomaterials and reveal vital information concerning material qualities such as level of disorder and sample crystallinity. BWSpec acquisition software can be programmed to automatically calculate different parameters such as G- and D-band intensity ratios and band FWHM. Graphene producers can easily use the analysis to achieve on-line or at-line measurements for material characterization, process monitoring, and product quality control.
References and Further Reading
- Ahn, C.; Fong, S.W.; Kim, Y.; Lee, S.; Sood, A.; Neumann, C.M.; Asheghi, M.; Goodson, K.E.; Pop, E.; Wong, H.S.P. Nano Letters 2015, 15, 6809-6814.
- Hegab, H.; Zou, L. Journal of Membrane Science 2015, 484, 95–106.
- Luo, C.; Xie, H.; Wang, Q.; Luo, G.; Liu, C. Journal of Nanomaterials 2015, 2015, 1–10.
- Mo, Y.L.; Roberts, R.H. Carbon Nanofiber Concrete for Damage Detection of Infrastructure, Advances in Nanofibers, Dr. Russel Maguire (Ed.), InTech, https://www.intechopen.com/books/advances-in-nanofibers/carbon-nanofiber-concrete-for-damage-detection-of-infrastructure, 2013.
- Deloitte Global analysis, 2015, https://www2.deloitte.com/in/en.html
- Childres, I.; Jauregui, L. A.; Park, W.; Cao, H.; Chen, Y. P. In New Developments in Photon and Materials Research; 2013; pp 1–20.
- Ferrari, A. C. Solid State Communications 2007, 143, 47–57.
- Nemanich, R. J.; Solin, S. A. Phys. Rev. B 1979, 20 (2), 392–401.

This information has been sourced, reviewed and adapted from materials provided by B&W Tek.
For more information on this source, please visit B&W Tek.