Materials characterization capabilities are essential at SilcoTek® for their role in developing new products and assisting customers with scale up as well as process troubleshooting. Multiple characterization techniques allow SilcoTek’s scientists to analyze surface bonding mechanisms, study coatings and develop a deep understanding of the coating’s protective properties.
SilcoTek technicians also use characterization tools in their daily QA/QC process to ensure all coatings meet the SilcoTek quality standards and to satisfy customer’s needs. Finally, it is not uncommon for SilcoTek customers to request characterization help with their specific substrates or coated parts.
As well as the in-house characterization capabilities, SilcoTek also has convenient access to a wide variety of characterization techniques at the Pennsylvania State University (PSU). This is a result of physical proximity to the University’s main campus and an established academic/industry relationship between PSU and SilcoTek. Consequently, the SilcoTek R&D scientists are certified users of many characterization instruments located at the Materials Characterization Lab (MCL) at PSU.
This article aims to provide a brief introduction of different materials characterization techniques available to SilcoTek, both through PSU and in-house, and to give customers a glimpse of the possibilities.
SilcoTek’s In-House Characterization Capability
X-ray Fluorescence (XFR) Analyzer
Every day SilcoTek® receives hundreds of customer parts that require coating. Most of these parts are stainless steel and this is a standard substrate for SilcoTek to treat. However, there are a few materials that are not compatible with the deposition process, either due to inhomogeneous film growth, low melting point and/or poor adhesion of the substrate material.
These include zinc, pure nickel plating, lead, gold, silver, copper and copper alloys such as Monel and brass.
SilcoTek uses a Thermo Scientific X-ray fluorescence (XRF) analyzer to avoid process disruptions caused by incompatible substrates. This is a non-destructive elemental analysis tool which identifies any unfamiliar incoming metal substrates.
In XRF, an X-ray photon strikes an atom in the sample and this knocks out an inner shell electron. The atom regains stability by filling the space in the inner shell with an outer shell electron. This process releases fluorescent X-ray whose energy is equal to the binding energy difference between the inner and outer shells.
The XRF can determine the elements present in a sample and their relative concentrations because each element in the sample emits its own unique fluorescent X-ray spectrum.
Standard detection range for the SilcoTek XRF analyzer covers elements from sulfur (S) to uranium (U). In samples with specifically defined chemical composition, e.g. common grades of metal alloys, the instrument can also identify most sample types by name within a few seconds. Figure 1 below shows an example output from the XRF analyzer of a stainless steel 316 sample.
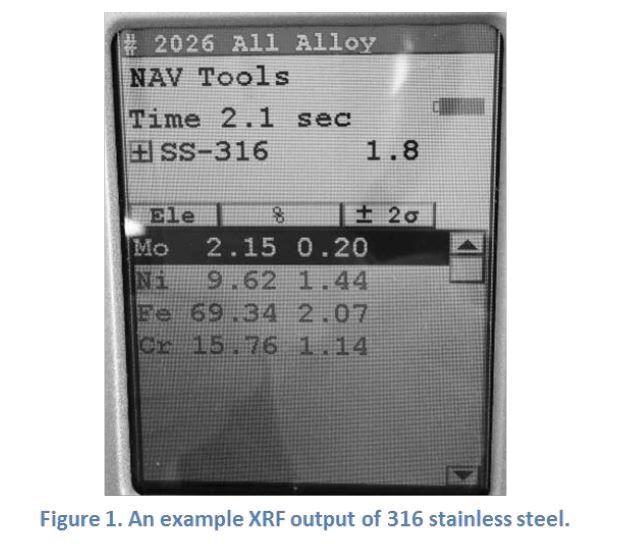
XRF benefits SilcoTek customers by helping to identify the metal type of substrate material and avoiding issues caused by substrate incompatibility.
Fourier Transform Infrared Spectroscopy (FTIR)
FTIR uses a broad band infrared radiation as the excitation source to probe molecular structures of multiple chemical species in either gas, liquid or solid state. The wavelengths at which absorption occurs are detected by a change in the intensity of light after reflection or transmission as a function of wavelength.
The absorption wavelength corresponds to a specific chemical bond excitation and can serve as a signature indicator for the type of bonds and the group of atoms involved at various vibrations. Therefore, information can be deduced about the functional groups that are present and how the atoms are connected to each other in a molecule. FTIR can be used to characterize both crystalline and amorphous materials unlike diffraction methods which are limited to crystalline substances.
SilcoTek’s Thermal Scientific Nicolet FTIR instrument is equipped with the standard, the Smart iTRÔ (Attenuated Total Reflectance), and Smart SAGE (Specular Apertured Grazing Angle) sampling accessories. This enables both transmission and reflection measurements in a versatile form of samples which includes liquids, thin films, pellets, and powders etc. SilcoTek technicians use the FTIR technique on a regular basis to perform the QA/QC duties and SilcoTek scientists use it to assist in their R&D projects.
Figure 2 shows a typical FTIR spectrum of SilcoTek’s Dursan® coating which has been taken in the reflection mode. It demonstrates Dursan’s characteristic absorption peaks which correspond to its constituent functional groups. The FTIR is one of the several essential quality control methods used by the SilcoTek production crew.
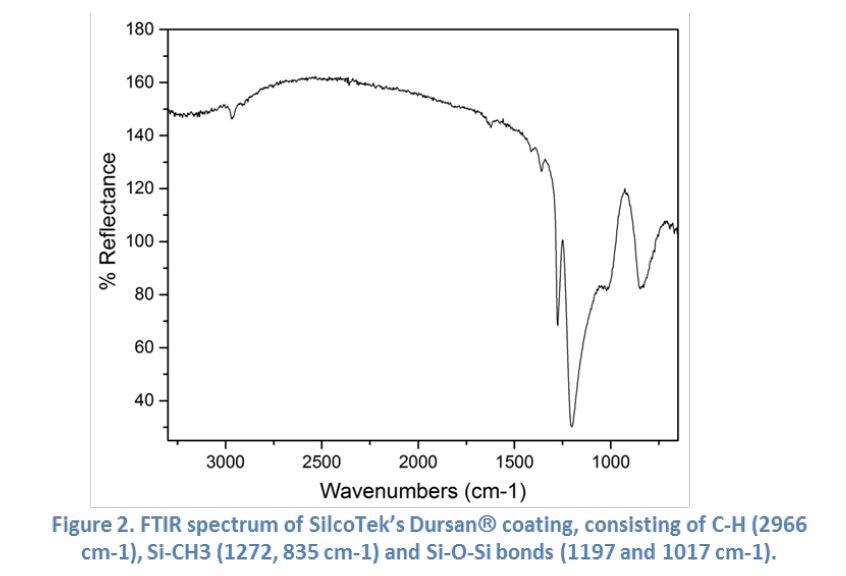
The FTIR benefits SilcoTek customers by helping to identify any organic contaminants and ensuring integrity of the coating later.
F20 Thin-Film Analyzer
The SilcoTek F20 thin-film analyzer (manufactured by Filmetrics Inc.) is a bench top tool that can be configured to measure optical constants (n and k: refractive index and extinction coefficient), thin film thicknesses (30 Å to 350 mm) and transmittance. SilcoTek uses it primarily as an accurate, quick and non-destructive way to measure coating thicknesses.
The F20 measures thin film thickness either by reflecting or transmitting light through the sample over a variety of wavelengths (SilcoTek typically uses the reflection mode). When light interacts with a coated sample it goes through reflection once at the upper and once at the lower boundary of the coating. These two reflections either add (called in-phase and shows up as a peak) or subtract (called out-of-phase and shows up as a valley) with each other.
This depends on the wavelength of the light and the thickness and optical properties (n and k) of the coating. If the optical properties and the wavelength are known, the thickness of the coating can then be extracted from the measurements. The reflectance spectrum that is produced is characterized by intensity oscillations. Generally, the thicker the coating (i.e. the longer the optical path difference between the two reflection waves), the more oscillations there will be in a given wavelength range.
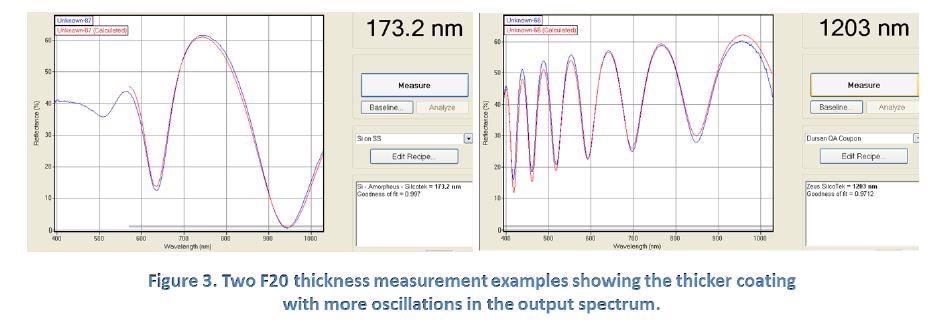
Figure 3 above shows two sample outputs from the F20 coating thickness measurement and illustrates how the number of oscillations relates to film thickness. The F20 measurement is calibrated to a NIST-traceable sample and has also shown excellent agreement with a direct cross-sectional measurement using the FIB/FESEM technique.
F20 benefits SilcoTek customers by providing thickness verification of the coating.
Surface Contact Angle Measurement
Contact angle is described as the angle that a drop of liquid makes to its (usually solid phase) contacting surface. It is measured throughout the droplet and the angle is formed between the solid surface and the liquid meniscus near the line of contact.
The contact angle indicates the wettability of a surface to a liquid, usually water, and the value of the contact angle may vary with the volume of the liquid drop. A surface is conventionally referred to as “hydrophobic” if its water contact angle is larger than 90° and “hydrophilic” if the angle is smaller than 90°.
Advancing contact angle is the contact angle produced with an increasing liquid drop volume. It senses the hydrophobic portion of the surface properties and represents the maximum angle value on that surface. The contact angle produced with a decreasing liquid drop volume is called the receding contact angle. It senses the hydrophilic portion of the surface properties and represents the minimum angle value on that surface.
The difference between the advancing and the receding values is called the angle hysteresis and is a measurement of the surface “stickiness.” Where liquid droplets are expected to “roll off” a surface, low hysteresis is desired. Contact angle hysteresis is generally believed to be due to surface roughness and/or heterogeneity1.
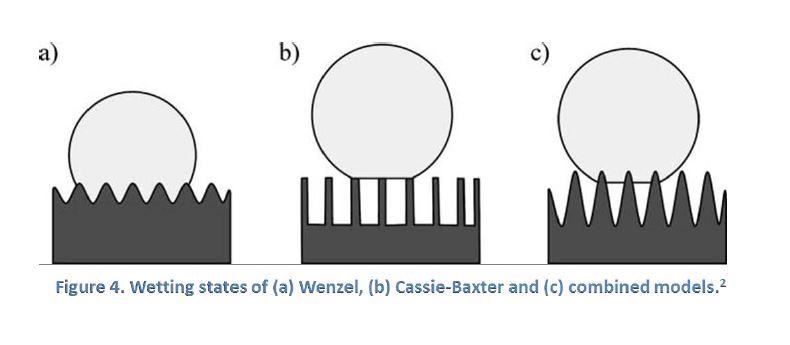
The effect of surface roughness on wetting state can be typically described by two models: Cassie-Baxter and Wenzel. The Wenzel model describes a situation where the liquid-solid contact follows the contours of a rough surface, with surfaces in the total wetting Wenzel state being “sticky” in that water drops tend to adhere more to them than to a corresponding flat surface.
In the Cassie-Baxter model, it is more energetically favorable for a liquid drop to rest upon a composite surface of flat solid tops and flat air gaps between them, effectively bridging across the tops of surface features. Surfaces following the Cassie-Baxter model are “slippery,” and liquid drops roll off more easily than on an equivalent flat surface.
The Cassie-Baxter state is the preferred state in a superhydrophobic application but the two states can convert from one to another. Experiments have demonstrated that surfaces with multiple scale roughnesses favor the transition into Cassie-Baxter state which allows for easy roll-off of water drops. Figure 4 below shows the wetting states discussed.
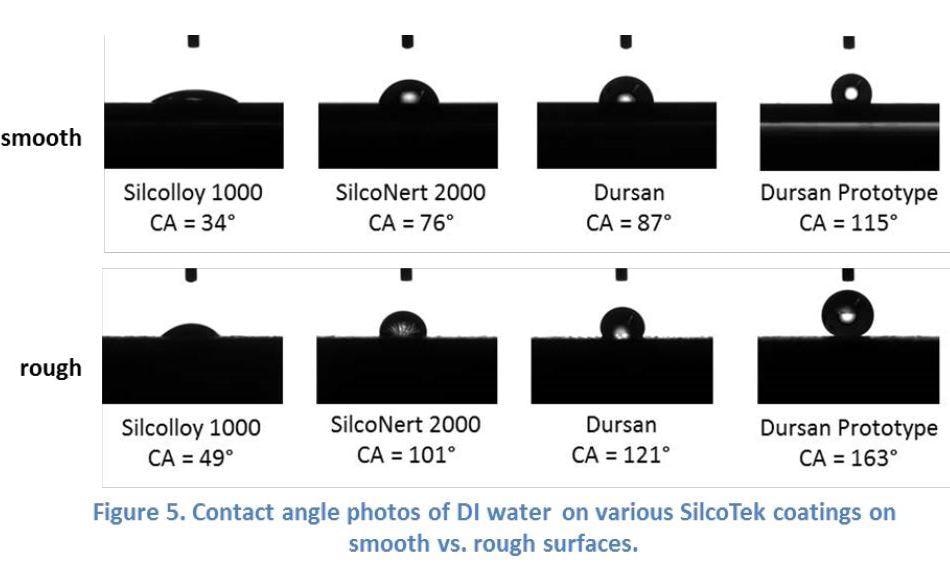
SilcoTek has two contact angle analysis instruments: a Krüss K100 tensiometer that provides bulk analysis of a larger area with both advancing and receding values, and a Ramé-Hart Model 200 goniometer that measures static equilibrium contact angles. Figure 5 below shows contact angle photos taken with the Ramé-Hart goniometer on a variety of SilcoTek coatings, demonstrating how surface roughness increases the contact angles.
SilcoTek scientists rely heavily on contact angle measurements in their research of hydrophobic and superhydrophobic surface development, where properly designed surface topography can bring out the extreme water-repellent property in a surface.
Contact angle measurement benefits SilcoTek customers by ensuring anticipated surface hydrophobicity/hydrophilicity as required by application and confirming surface bonding.
Electrochemical Impedance Spectroscopy (EIS)
EIS is a very useful and mostly non-destructive tool used to study and evaluate the performance of protective coatings on metal substrates. The measurement gives information on coating capacitance, coating resistance, Faradaic impedance and double layer capacitance which are related to the performance and failure process of coatings.
Electrical impedance is a measure of the ability of a circuit element to oppose the flow of electrical current when applying a voltage. It can be considered to be an extension of the simple “resistance” concept in an AC circuit. Impedance is a complex quantity and possesses both magnitude and phase, unlike resistance which only has magnitude.
EIS measures the current response of an electrochemical cell by applying an AC potential to it. Fitting it to an equivalent electrical circuit model allows data obtained to be analyzed. A good coating that exhibits excellent protection to the base metal shows pure capacitive behavior and usually displays very high impedance at low frequencies.
Figure 6 below is an example of what the Bode plot of an ideal protective coating would look like4. A Bode plot is a way of presenting the EIS measurement results with a singular x-axis value (the log frequency), and two y-axis values (Figure 6 left: the y-axis is the magnitude of the impedance in ohm; Figure 6 right: the y-axis is the phase shift of the impedance in degree).
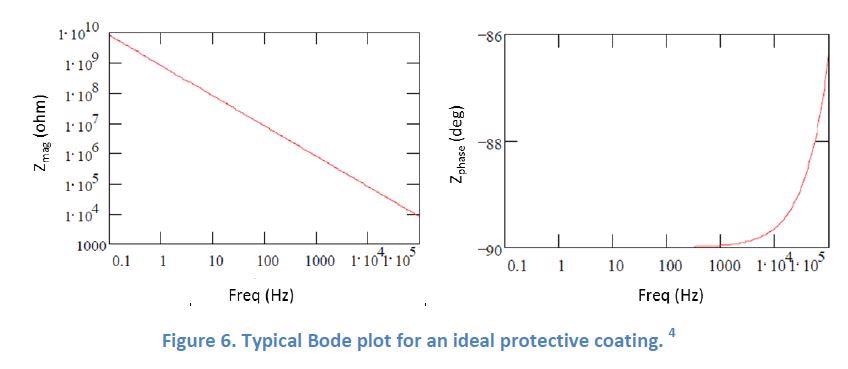
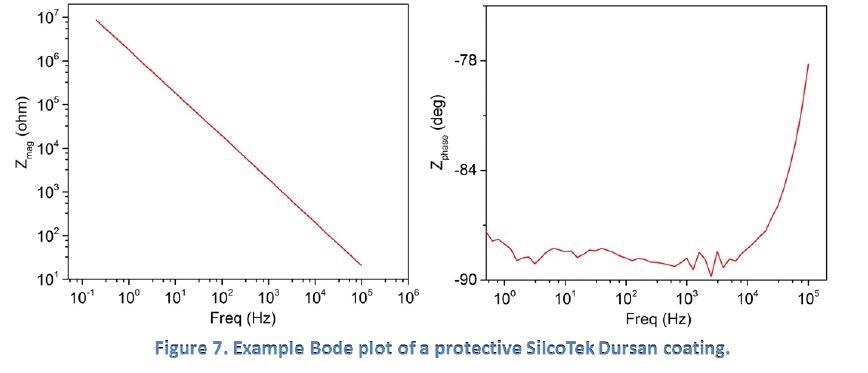
Figure 7 below shows the EIS behavior of a protective SilcoTek Dursan coating when in a 5% NaCl solution. As the frequency decreases, the impedance magnitude increases steadily in a straight line (left), and the phase angle stays low and flat near -90 degrees (right). This is an excellent example of the behavior of an ideal protective coating as shown in Figure 6.
The degradation of a purely capacitive coating through uptake of the solution into the coating is shown in Figure 8. Solution penetration of the coating adds a resistor component (solution resistance) to the electrochemical system and this results in the impedance magnitude losing its linear characteristics when the slope starts to change at approximately 100 Hz.
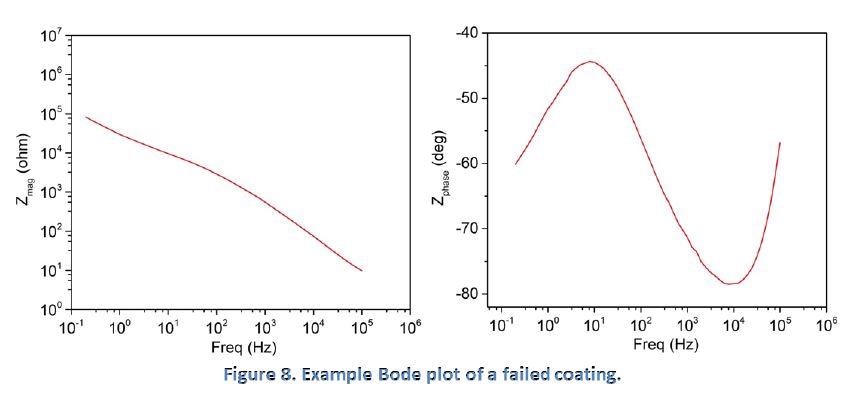
The phase angle continuously deviates from the ideal -90 degrees which indicates the permeation of the coating by the solution and the start of electrochemical reactions under the coating.
EIS benefits SilcoTek customers by providing corrosion performance analysis of coating and helping to analyze failure mechanisms.
References
- Y. Yuan and T. R. Lee, “Contact angle and wetting properties”, Surface Science Techniques 2013, DOI 10.1007/978-3-642-34243-1_1.
- P. Roach, N. J. Shirtcliffe and M. I. Newton, “Progress in superhydrophobic surface development”, Soft Matter 2008, 4, 224.
- Y. Zuo, R. Pang, W. Li, J. P. Xiong and Y. M. Tang, “The evaluation of coating performance by the variations of phase angles in middle and high frequency domains of EIS”, Corrosion Science 2008, 50, 3322.
- Gamry Instruments Application Note “Basics of electrochemical impedance spectroscopy”.
- C. R. Brundle, C. A. Evans Jr. and S. Wilson, “Encyclopedia of materials characterization: surfaces, interfaces, thin films”, Butterworth-Heinemann, 1992.
This information has been sourced, reviewed and adapted from materials provided by Silcotek.
For more information on this source, please visit Silcotek.