Together with water, foods supply the main part of the total daily intake of trace elements by humans. In the human diet around the world, vegetables and spices are some of the most common foods.
In addition to polluted water and soil, foods can also be contaminated with trace metals due to the increasing use of chemicals, the introduction of mechanized farming, food processing and packaging, etc.
It is crucial to measure and continuously monitor the levels of trace elements in different types of food materials to minimize adverse effects. Trace element food composition data is also vital for both health professionals and consumers.
Food labeling legislation has enforced this requirement in recent years. Trace element determination in complex matrices like food often requires sample preparation before determination by instrumental methods.1
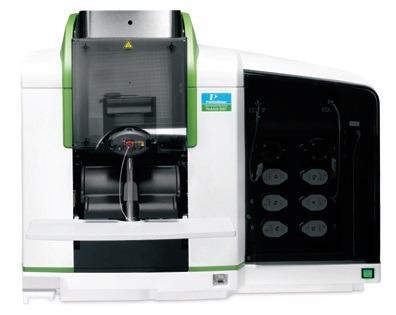
Figure 1. PerkinElmer PinAAcle 900T atomic absorption spectrophotometer. Image Credit: PerkinElmer Food Safety and Quality
Manganese (Mn), cobalt (Co), nickel (Ni), copper (Cu) and zinc (Zn) are all key elements for both mammals and plants. They play vital roles in many biological processes, including carbohydrate and lipid metabolism.2
For instance, a daily copper intake of 1.5 - 2.0 mg is vital, and copper at nearly 40 ng/mL is needed for the normal metabolism of many living organisms.3 Yet, copper at higher levels is toxic to the kidneys and circulatory system.
The trace element content of food items for all the key elements mentioned above must be controlled on a daily basis.
There is a growing requirement to monitor the key element levels in food samples at ever-decreasing concentrations. Highly sensitive, yet fast and inexpensive techniques are needed for this purpose.
The quantification of trace metals in food samples has routinely been performed by inductively coupled plasma optical emission spectroscopy (ICP-OES),4 inductively coupled plasma mass spectrometry (ICP-MS),5,6 graphite furnace atomic absorption spectrophotometry (GFAAS)7 and flame atomic absorption spectrophotometry (FAAS).8,9,10
FAAS has the characteristics of good precision and simplicity with lower cost and minimum operator proficiency compared to other methods.
The objective of this work is two-fold:
- To accurately analyze the levels of essential metals (in particular: copper, nickel, cobalt, manganese and zinc) which may be present in some major spice brands available on the market, using FAAS.
- To cross reference the measured levels to the recommended maximum tolerable daily intake limits specified by the U.S. Department of Agriculture (USDA).
Experimental Conditions
Instrumentation
A PerkinElmer® PinAAcle™ 900T atomic absorption spectrophotometer (Shelton, CT, USA) equipped with the intuitive WinLab32™ for AA software was utilized to carry out the measurements. It features all the tools required to analyze samples, report and archive data and ensure regulatory compliance.
Outstanding signal-to-noise ratios are supplied by the high-efficiency optical system and solid-state detector utilized in this spectrophotometer. The solid-state detector is also highly efficient at low UV and longer wavelengths at the same time.
Table 1 shows the instrumental conditions for flame experiments. A high-sensitivity nebulizer (Part No. N3160144) was employed, and for all samples, the read time was 3 seconds. The calibration equation was linear through zero, and the signal type was AA.
Table of Contents
Table 1. Optimized experimental conditions of PinAAcle 900T. Source: PerkinElmer Food Safety and Quality
| Analyte |
Co |
Cu |
Mn |
Ni |
Zn |
| Wavelength (nm) |
240.73 |
324.75 |
279.48 |
232.00 |
213.86 |
| Slit (nm) |
0.2 |
0.7 |
0.2 |
0.2 |
0.7 |
| Lamp Current (mA) |
30 |
15 |
20 |
25 |
15 |
| Calibration Stds (mg/L) |
0.25, 0.5,
1.0 |
0.16, 0.32,
0.64 |
0.125, 0.5,
1.0 |
0.5, 1.0,
2.0 |
0.06, 0.12,
0.24 |
| r2 |
0.9995 |
0.9999 |
0.9998 |
0.9994 |
0.9999 |
| QC Std (mg/L) |
0.50 |
0.32 |
0.50 |
1.0 |
0.12 |
| Lamp Type |
HCL |
HCL |
HCL |
HCL |
HCL |
| Lamp Part No. |
N3050118 |
N3050121 |
N3050152 |
N3050145 |
N3050191 |
A microwave sample preparation system was employed for the digestion of spice samples and the certified reference material (CRM). This is an industrial-type microwave oven that is equipped with numerous accessories to optimize sample digestion.
The samples were digested by utilizing 100 mL high pressure vessels made of PTFE. The sample digestion was carried out in accordance with the program shown in Table 2, as per U.S. Environmental Protection Agency (EPA) Method 3052.
Table 2. Program used for the digestion of spices and herbs. Source: PerkinElmer Food Safety and Quality
| Sequence |
1 |
2 |
| Power (watts) |
1000 |
0 |
| Ramp Time (min) |
10 |
0 |
| Hold Time (min) |
10 |
20 |
| Weight Taken (mg) |
~500 |
| H2O2 (mL) |
1.0 |
| HNO3 (mL) |
7.0 |
| Temp (°C ) |
180 |
Standards, Samples and Certified Reference Material Preparation
Single-element PerkinElmer Pure Calibration Standards for atomic spectroscopy were employed as the stock standards for preparing the working standards (Part Nos. Co: N9303766; Cu: N9300183; Mn: N9303783; Ni: N9300177; Zn: N9300178).
Working standards were prepared by serial volume/volume (v/v) dilution in 50 mL conical free-standing polypropylene vials (Part No. B0193234).
For each individual metal ion, four-point calibration curves (three standards and one blank) were created. Before the start of the sample analysis, their calibration curve correlation coefficients (r2) were better than 0.999, as seen in Appendix I.
The calibration blank and for all dilutions was ASTM® Type I water (Millipore® Corporation, Billerica, Massachusetts, U.S.) acidified with 0.2 % nitric acid (Tamapure®,TAMA Chemicals, Japan). To validate the technique, NIST® 1568a CRM for Trace Metals in Rice Flour was utilized.
For each element, quality control (QC) check standards were prepared at the calibration curve midpoint. Three branded powdered spice and herb samples available in India were bought from a supermarket to be analyzed (ginger powder, coriander powder and black pepper powder).
Around 0.5 g of each sample or CRM was accurately weighed in duplicate and transferred to a digestion vessel. The digested samples were brought up to 25 mL in polypropylene vials with 0.2 % HNO3.
All sample vessels were rinsed abundantly in deionized water before use and cleaned by soaking with 10 % v/v HNO3 for at least 24 hours.
Results and Discussions
The role of the sample introduction system is key to optimizing the short-term stability of signals. The best sensitivity can also be achieved by the careful optimization of flame conditions. To achieve the best possible sensitivity, WinLab32™ for AA software comes with a unique “Optimize Gas Flows” feature.
This is a vital feature to assist in the analysis of low-level analytes in high matrix samples.
Even for the high acid matrix samples like the one used here, the new easy-fit sample introduction system with the inert polymer spray chamber and high-precision nebulizer maximizes short-term sensitivity and stability.
This is evident from the excellent percent relative standard deviation (%RSD) values that were gathered for low concentration standard signals, as seen in Table 3.
Table 3. Precision at midpoint of calibration for 10 replicate readings (%RSD). Source: PerkinElmer Food Safety and Quality
| Analyte |
% RSD |
Concentration (mg/L) |
| Co |
0.8 |
0.50 |
| Cu |
0.7 |
0.32 |
| Mn |
0.9 |
0.50 |
| Ni |
0.7 |
1.0 |
| Zn |
0.9 |
0.12 |
The agreement between the measured values and the certified values of the CRM were good, which showed the accuracy of the calibration produced, in addition to the overall accuracy of the developed technique, as seen in Table 4.
Table 4. Analysis of certified reference material by FAAS. Source: PerkinElmer Food Safety and Quality
| Analyte |
NIST® 1568a Rice Flour |
| Certified Value (μg/g) |
Measured Value (μg/g) |
| Cu |
2.4 ± 0.3 |
2.30 ± 0.7 |
| Mn |
20.0 ± 1.6 |
20.0 ± 0.2 |
| Zn |
19.4 ± 0.5 |
18.8 ± 0.1 |
*Co and Ni were not reference elements.
Method detection limits (MDLs) were calculated (shown in Table 5) based on the standard deviation of seven replicates of the reagent blank (Student’s t-value = 3.14, ρ = 0.02) and took into consideration the dilution factor of the samples.
Table 5. Typical method detection limits (MDLs) for the analysis of essential elements in spices. Source: PerkinElmer Food Safety and Quality
| Analyte |
MDL (mg/L) |
| Co |
0.50 |
| Cu |
0.45 |
| Mn |
0.15 |
| Ni |
0.30 |
| Zn |
0.10 |
These limits were gathered under routine operating conditions. The extremely low detection limits demonstrate the ability of the PinAAcle 900T spectrometer to analyze challenging matrices at the measured concentrations.
Post-digestion recovery studies were performed, and the results are outlined in Table 6. The recoveries gathered for post-digestion spikes easily adhered to the U.S. EPA guideline of ±15 %.
Yet, the incomplete mineralization of samples during the microwave digestion process may lead to difficulty in transferring analytes into solution and to disturbances in the spectrochemical measurements.11
Table 6 shows a summary of the spice analysis results.
Table 6. Post-digestion spike recovery study – concentrations are based on the diluted solutions (two replicates (n=2) were performed for each sample). Source: PerkinElmer Food Safety and Quality
| Analyte |
Sample Recovery (%) |
Spike Level (mg/L) |
| Black Pepper Powder |
Ginger Powder |
| Co |
90 |
96 |
0.5 |
| Cu |
101 |
106 |
0.16 |
| Mn |
94 |
87 |
0.13 |
| Ni |
90 |
90 |
0.5 |
| Zn |
102 |
105 |
0.06 |
For instance, 10.0 mg copper is the maximum tolerable daily intake limit specified by the USDA. The results shown in Table 7 indicate that the level of Cu will not exceed the maximum tolerable daily intake limits specified by the USDA, assuming that no one would be consuming ≥ 300 g of the spice mixture a day.4
Table 7. Concentration of metals in spice and herb samples using FAAS compared to USDA guidelines (two replicates (n=2) were performed for each sample and sample duplicate). Source: PerkinElmer Food Safety and Quality
| Analyte |
USDA Regulatory Level (mg) |
Black Pepper Powder (mg/kg) |
Coriander Powder (mg/kg) |
Ginger Powder (mg/kg) |
| Sample |
Duplicate |
Sample |
Duplicate |
Sample |
Duplicate |
| Co |
* |
0.80 |
0.82 |
0.65 |
0.75 |
1.5 |
1.3 |
| Cu |
10.0 |
32.3 |
33.3 |
13.9 |
13.8 |
5.9 |
5.6 |
| Mn |
11.0 |
185 |
189 |
145 |
145 |
770 |
745 |
| Ni |
* |
4.1 |
4.0 |
1.7 |
1.4 |
2.3 |
2.1 |
| Zn |
40.0 |
39 |
36 |
74 |
71 |
50 |
51 |
*No USDA reference value for specified tolerable upper intake level was found.
Conclusions
Techniques were developed to accurately determine Mn, Ni, Co, Cu and Zn in spice mixtures by utilizing microwave digestion and the PinAAcle 900T atomic absorption spectrometer in the FAAS mode.
The results confirmed that FAAS on the PinAAcle 900T can perform the determination of cobalt, nickel, copper, manganese and zinc in spices after acid solubilization by microwave digestion without any interference.
For this application, the PinAAcle 900H (Flame and Deuterium Furnace) and PinAAcle 900F (Flame only) spectrometers can also be used.
Appendix I – Calibration Graphs for Different Analytes
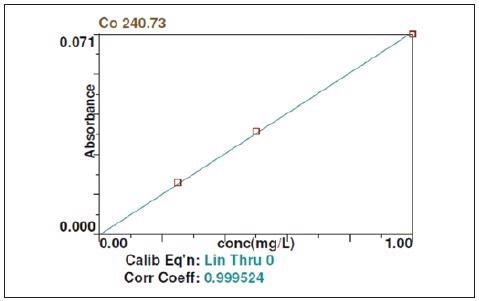
Figure 2. Calibration curve for the detection of Co using FAAS. Image Credit: PerkinElmer Food Safety and Quality
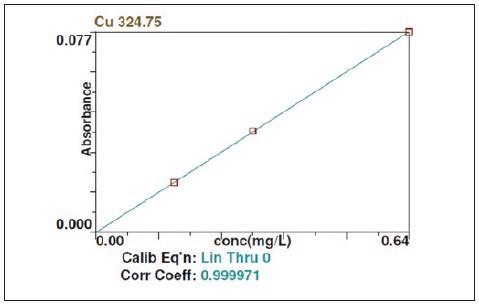
Figure 3. Calibration curve for the detection of Cu using FAAS. Image Credit: PerkinElmer Food Safety and Quality
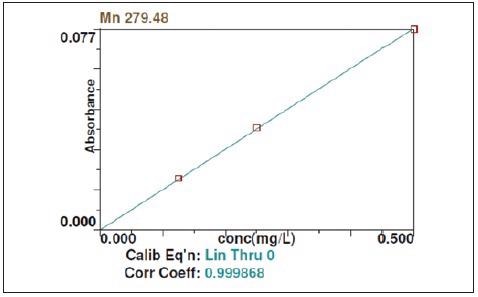
Figure 4. Calibration curve for the detection of Mn using FAAS. Image Credit: PerkinElmer Food Safety and Quality
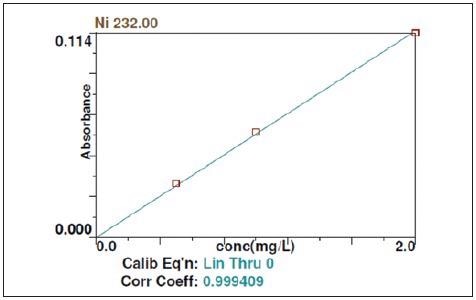
Figure 5. Calibration curve for the detection of Ni using FAAS. Image Credit: PerkinElmer Food Safety and Quality
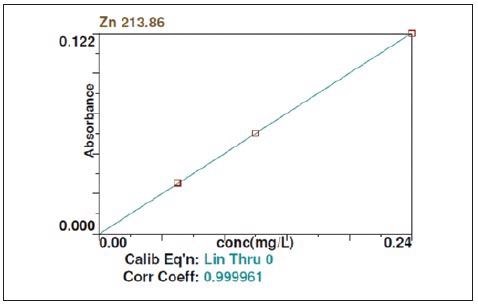
Figure 6. Calibration curve for the detection of Zn using FAAS. Image Credit: PerkinElmer Food Safety and Quality
References
- M.N. Matos-Reyes, M.L. Cervera, R.C. Campos and M. de la Guardia, Food Chemistry 122 (2010) 188–194.
- E. Kenduzler, A.R. Turker, 572, Anal. Chim. Acta 480 (2003) 259–266.
- A.R. Ghiasvand, R. Ghaderi and A. Kakanejadifard, Talanta 62 (2004) 287–292.
- Q. He, X.J. Chang, X.P. Huang, Z. Hu, Microchim. Acta 160 (2008) 147–152.
- D. Hammer, M. Nicolas and D. Andrey, At. Spectrosc. 26 (2005) 203–208.
- E.P. Nardi, F.S. Evangelista, L. Tormen, T.D.S. Pierre, A.J. Curtius, S.S. de Souza and F. Barbosa Jr., Food Chem. 112 (2009) 727–732.
- R. Manjusha, K. Dash and D. Karunasagar, Food Chem. 105 (2007) 260–265.
- M.H. Mashhadizadeh, M. Pesteh, M. Talakesh, I. Sheikhshoaie, M.M. Ardakani, and M.A. Karimi, Spectrochim. Acta Part B 63 (2008) 885–888.
- V.A. Lemos, D.G. da Silva, A.L. de Carvalho, D.D. Santana, G.D. Novaes and A.S. dos Passos, Microchem. J. 84 (2006) 14–21.
- J.A. Da-Col, S.M.A. Domene and E.R. Pereira, Food Anal. Methods 2 (2009) 110–115.
- I. Baranowska, K. Srogi, A. Włochowicz, K. Szczepanik, Polish Journal of Environmental Studies, 11(5) (2002) 467–471.

This information has been sourced, reviewed and adapted from materials provided by PerkinElmer Food Safety and Quality.
For more information on this source, please visit PerkinElmer Food Safety and Quality.