FTIR spectroscopy has traditionally been used to characterize packaging materials. Yet, the increasingly thin layers in packaging materials currently being developed often exceed the spatial resolution limits of conventional FTIR techniques.
O-PTIR allows for submicron-level IR characterization of thin multilayer films in a reflection mode, eliminating the need for sample preparation. The technique employs an IR probe laser to generate Raman scattering, enabling the simultaneous acquisition of IR and Raman spectra.
Introduction
This article will focus on the analysis of a range of multilayered film samples using the mIRage-R microscope. This microscope has the unique capability of simultaneously capturing IR and Raman spectra with submicron resolution from the same spot on a sample.
Traditional FTIR spectroscopy has been used to characterize packaging materials for many years. However, due to the increasingly thin layers in modern packaging materials, the spatial resolution limitations of conventional FTIR techniques are often surpassed.
The mIRage-R microscope, based on the principle of Optical Photothermal IR (O-PTIR) spectroscopy, allows for the submicron-level IR characterization of thin multilayer films using a non-contact reflection mode IR technique. This technique simplifies sample preparation and significantly reduces time-to-data.
Additionally, the IR probe laser generates Raman scattering, enabling the simultaneous acquisition of both IR and Raman spectra.
Image Credit: Photothermal Spectroscopy Corp.
(O-PTIR) Optical Photothermal IR Spectroscopy
O-PTIR helps to overcome the IR diffraction limit by combining a mid-IR pulsed tunable laser with a visible probe beam. When the IR laser is set to a wavelength that excites a molecular vibration in the sample, it creates absorption, resulting in photothermal effects.
The visible probe laser, with a spot size of approximately 0.5 μm, measures the photothermal response through scattered light, as illustrated in Figure 1. The IR laser can scan through the entire fingerprint region to obtain an IR spectrum in one second or less.
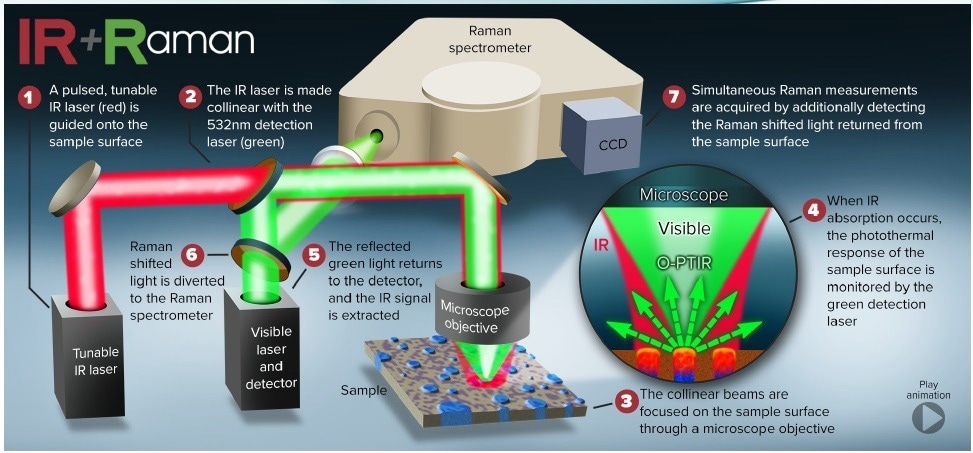
Figure 1. Schematic representation of the beam paths for the generation of simultaneous IR and Raman spectra. Image Credit: Photothermal Spectroscopy Corp.
Minimizing Sample Preparation
O-PTIR is a non-contact technique that allows for the measurement of IR on thick samples, eliminating the need for thin samples for many sample types. This results in easier sample preparation, improved ease of use, and faster turnaround times.
Conventional transmission mid-IR spectroscopy is typically unsuitable for measuring thick samples because the light can be absorbed or scattered before it finishes transmitting through the sample, resulting in little photon energy reaching the detector.
However, with O-PTIR, these materials can now be analyzed. In the study discussed in this article, all films were analyzed by creating a bulk cross-section of the sample embedded in epoxy. Thin sections were not required.
Simultaneous IR and Raman Line Array Measurements
This example showcases the capability of the simultaneous IR and Raman analysis to identify various components accurately.
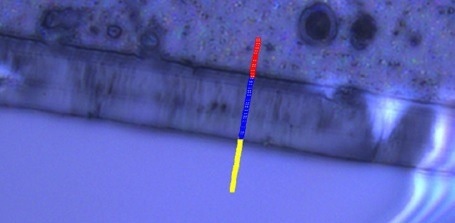
Figure 2. 40x Optical image of cross sectioned film 1. Markers indicate position for simultaneous IR and Raman spectra. Image Credit: Photothermal Spectroscopy Corp.
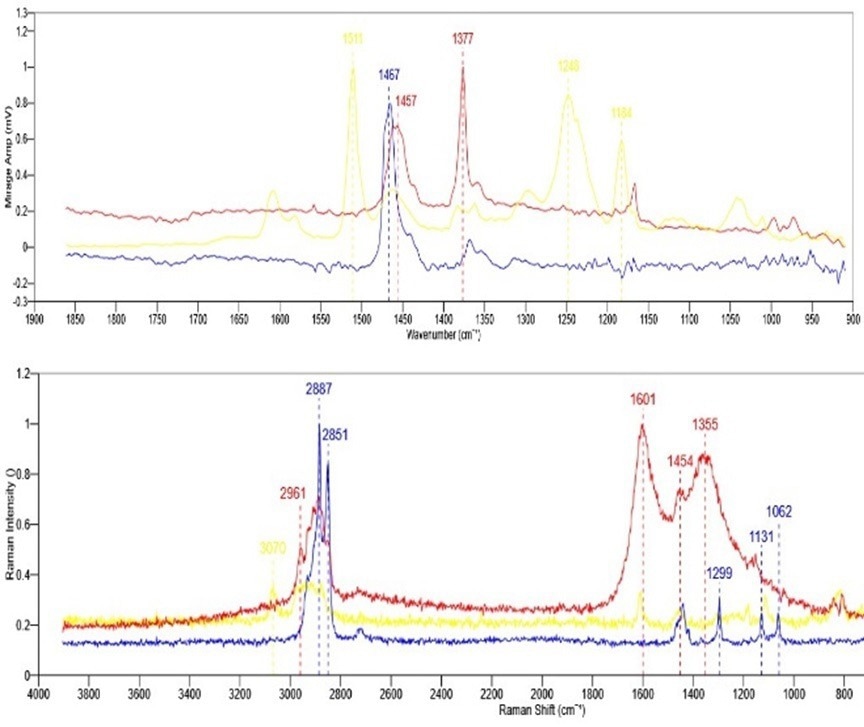
Figure 3. Top- IR spectra collected from film 1. Bottom-Simultaneously collected Raman spectra. Image Credit: Photothermal Spectroscopy Corp.
Figure 2 illustrates the color-coded points, and representative IR and Raman spectra from each point are shown in Figure 3. The line array points have a data spacing of 500 nm.
As O-PTIR spectra correlate excellently with traditional FTIR spectra, they can be easily searched using existing spectral databases. In this study, each spectrum was searched against the KnowItAll spectral database from BioRad.
The search for IR spectra identified two main polymer layers - polyethylene and polypropylene - along with the embedding epoxy (not shown). However, one of the primary film components was not observed or identified using the IR analysis.
The full picture was completed using Raman spectra. The simultaneously acquired Raman spectra were searched against the KnowItAll Raman database for identification, as shown in Figure 4.
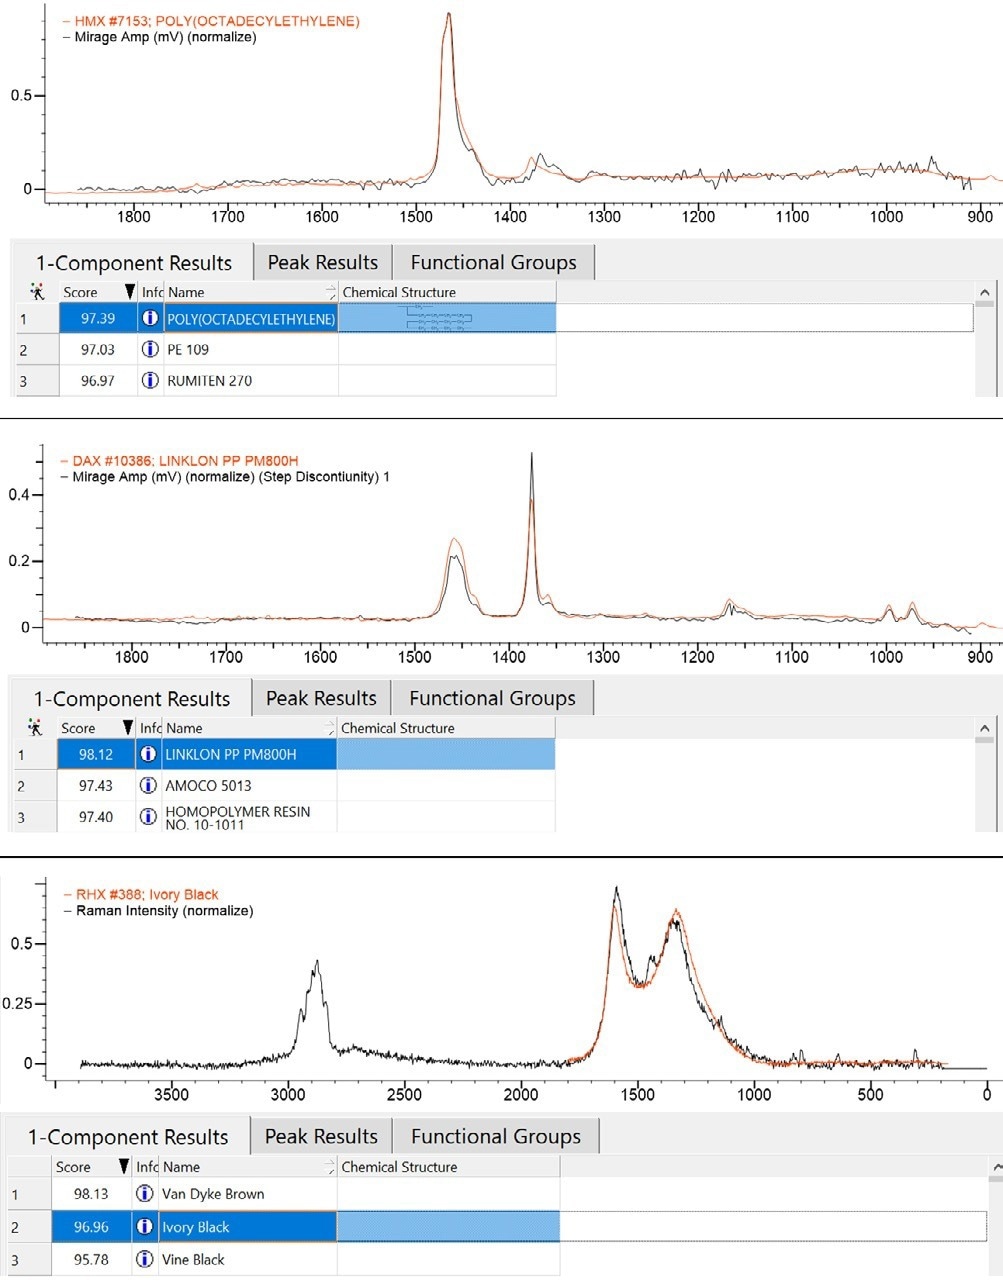
Figure 4. KnowItAll spectra database results for the main polymer layers in film 1. Top-Blue spectra identified as PE, Middle-Red spectra identified as PP, Bottom-KnowItAll spectral database identifies the red spectrum as carbon black. Image Credit: Photothermal Spectroscopy Corp.
From the combinational analysis of both IR and Raman, it was concluded that the layer represented by the red spectrum is composed of polypropylene loaded with carbon black.
Single Wavelength Imaging for Visualizing Chemical Distribution
Maintaining the chemical distribution within layered films is crucial for ensuring product integrity. The mIRage-R microscope provides a unique capability of high-resolution single-wavelength imaging, which can highlight the distribution of specific components within any sample.
After collecting O-PTIR spectra on the film, images can be obtained at distinctive absorption bands for each layer, allowing the boundaries and interfaces of each layer to be highlighted.
Figure 5 displays an optical image of another cross-sectioned multilayer film from a different sample.
As depicted in the line array data, a region approximately 2 µm wide displays a notably different spectrum compared to the surrounding areas. The red spectra in Figure 6 reveal a significantly increased C-H stretching with an additional peak at 1462 cm-1.
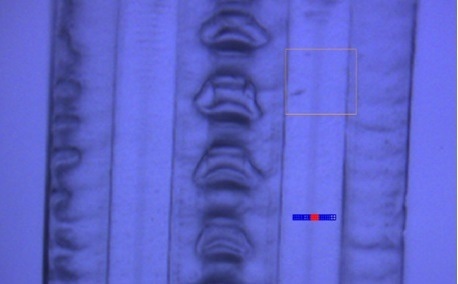
Figure 5. 40 x optical image of film two embedded in epoxy. Markers represent an 11 μm line array with 250 nm spacing. Image Credit: Photothermal Spectroscopy Corp.
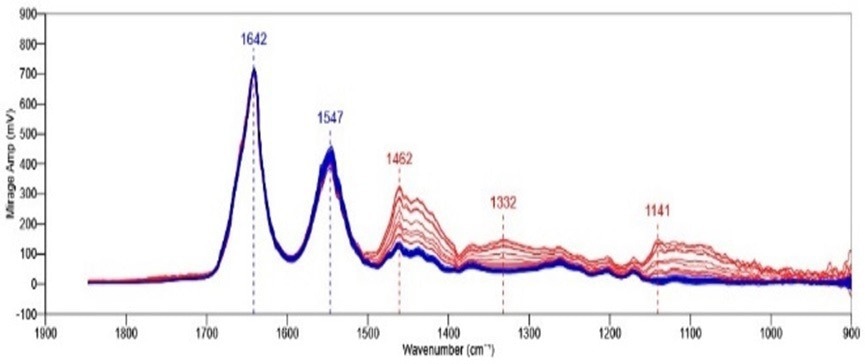
Figure 6. mIRage line array spectra collected from locations shown in figure 5. Data has been normalized to 1642 cm-1. Image Credit: Photothermal Spectroscopy Corp.
Single wavelength imaging, as shown in Figure 7, enables the visualization of various layer thicknesses and distributions with unparalleled spatial resolution. The mIRage+R microscope operates in a non-contact reflective regime, providing high-quality single-wavelength images.
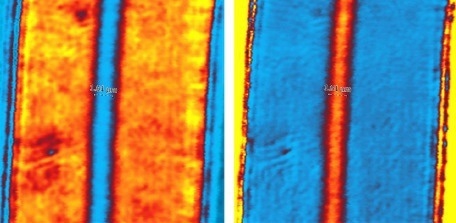
Figure 7. Top- IR spectra collected from film 1. Bottom-Simultaneously collected Raman spectra. Image Credit: Photothermal Spectroscopy Corp.
Summary
The mIRage-R microscope has proven to be a valuable tool in the analysis of various multilayer films. The device allows for the simultaneous collection of both IR and Raman spectra, which exhibit an excellent correlation to traditional FTIR spectra and can be readily searched in existing databases.
The use of multiple techniques provides a more comprehensive understanding of the film's composition than what a single technique alone can offer.
Moreover, the O-PTIR enables complete visualization of sample components with submicron resolution through single-wavelength imaging.
This newly developed technique provides reliable and reproducible sub-micron IR spectroscopy, making it a promising solution to various analytical and production challenges.
Acknowledgments
Photothermal Spectroscopy Corp wishes to acknowledge the support of Dr. Madina Shamsuyeva of the Institute of Plastics and circular economy at IKK Hannover.

This information has been sourced, reviewed and adapted from materials provided by Photothermal Spectroscopy Corp.
For more information on this source, please visit Photothermal Spectroscopy Corp.