Mass spectrometry (MS) is crucial for developing and manufacturing modern biological medical products. It has facilitated the recent increase in approved biologic license applications (BLAs).1,2
The valuable data delivered by MS assists the shift toward Process Analytical Technologies (PAT) and Quality by Design (QbD) driven by the pharmaceutical industry and regulatory bodies.3
Despite the potential of traditional MS to improve process safety, economics, and efficiency, the utilization of this method for real-time process monitoring in biologics manufacturing has been restricted to centralized analytical laboratories because of factors such as cost, size, and complexity.
This article discusses the utilization of the Microsaic Metabolite Monitoring PAT system, which is comprised of a Microsaic 4500 MiD® compact Mass Spectrometer together with a Hydrophobic Interaction Chromatography (HILIC) workflow, in the upstream manufacturing of a biotherapeutic.
To work automatically in an upstream bioprocessing workflow, this system was integrated with the Cogent Datahub and Seg-Flow automated sampling system (Flownamics), as well as PharmaMV software (Perceptive Engineering).
This enabled the continuous monitoring of metabolites and glucose control in a large 10 L upstream cell culture close to real-time and at high frequency.
Methodology
The Microsaic Metabolite Monitoring PAT system comprises a miniaturized microflow electrospray ionization (ESI) source MS and a HILIC Chromatography workflow.
The MS detector used in this workflow was Microsaic’s 4500 MiD® miniaturized point-of-need MS paired with a chip-based single quadrupole.
The dimensions of Microsaic’s 4500 MiD® system are 55 x 35 x 25 cm, with all vacuum pumps and the control PC contained in one unit. A modified Microsaic MiDas™ conducted the HILIC workflow and sample delivery.
This modified MiDas™ included a 2-position 10-port switching valve, a ceramic pump head for biocompatibility, as well as an additional column oven. The modified MiDas™ received samples from the Seg-Flow automated sampling system and control of an isocratic HILIC separation.
Since both the 4500 MiD® MS and the MiDas™ are so compact, the system can be utilized at the point-of-need on the bench, adjacent to a bioreactor autosampler, facilitating near real-time monitoring.
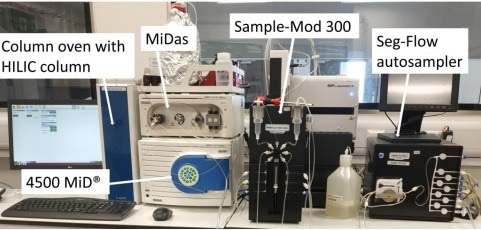
Figure 1. Experimental configuration of the Microsaic Metabolite Monitoring PAT system – The autosampler, consisting of a Seg-Flow autosampler coupled to a Sample-Mod 300 (right), sampled from the 10 L bioreactor at a pre-defined time interval and delivered these filtered cell culture samples to the 1 µL injection loop on the MiDasTM equipped with a ceramic pump head (left). Samples were separated using HILIC chromatography before analysis by the point-of-need 4500 MiD®. Image Credit: Microsaic Systems plc
Microsaic’s control software, Masscape®, was employed to control the Microsaic Metabolite Monitoring PAT system.
The workflow was programmed to communicate with the Open Platform Communications (OPC) server with different system states and to conduct tasks automatically upon receiving a trigger from the OPC server. These tasks include system start-up, loop cleaning, and column equilibration.
Accompanied by a Flownamics Sample-Mod 300, the Flownamics Seg-Flow 4800 autosampler regularly sampled the cell media from the bioreactor. The autosampler clarified the samples by filtration and then delivered these samples to the modified Microsaic MiDasTM, as shown in Figure 1.
The filtered samples were directly delivered to the 1 µl sample loop on the modified MiDasTM. To separate the metabolites of interest, the samples were injected into a HILIC column before the Point-of-Need 4500 MiD® MS detection for analysis.
Control and communication of these processes were enabled using the OPC server with Remote Operations Protocol (ROP) commands.
Before analysis of the cell broth samples from the bioreactor, a 10-point calibration was carried out utilizing matrix-matched standard samples. Here, only glutamate, glutamine, glucose, and lactate were monitored and quantified regularly using the Microsaic Metabolite Monitoring PAT system.
The concentrations were automatically determined by Masscape®, which employs purpose-designed algorithms for the automatic analysis of metabolite concentrations. These calculated concentrations were utilized to export data directly to the PharmaMV software.
Anti-Her2 IgG1 expressing CHO cells were utilized and cultivated in the 10 L Biostat B-DCU bioreactor (Sartorius Stedim Biotech, Germany) at the Centre for Process Innovation (CPI).
The temperature, pH, agitation, and dissolved oxygen (DO) were controlled at constant values, while the glucose level in the bioreactor was monitored using the Microsaic Metabolite Monitoring PAT system.
The results were employed by the PharmaMV software to control glucose concentrations to a pre-defined target of 4000 mg/L.
Further metabolites, such as amino acids, were separated on the column and were studied with the 4500 MiD® MS, but these metabolites were not quantified.
Results
Employing the Microsaic Metabolite Monitoring PAT system enabled the concentrations of the four metabolites to be monitored simultaneously from one injection. This decreased the required sample volume and analytical time for each analysis.
Simultaneously measuring metabolites with orders of magnitude differences in concentrations, such as glutamine and glucose, was possible due to the wide dynamic range (3-4 orders of magnitude) of the Point-of-Need 4500 MiD® MS.
This enabled filtered cell broth samples to be directly injected into the system without the requirement for further dilution steps, as shown in Figure 2.
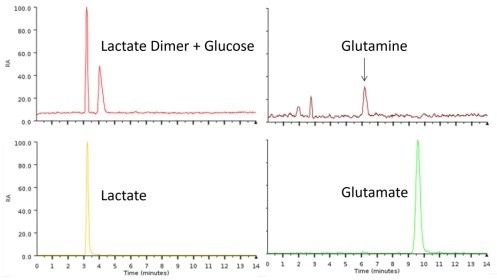
Figure 2. Typical chromatogram showing the simultaneous metabolite profiling of the filtered cell broth sample delivered from the bioreactor via the autosampler. Image Credit: Microsaic Systems plc
Upon receiving 68 triggers from the OPC server, the Microsaic Metabolite Monitoring PAT system had a 100% start-up success rate during cell culture.
During the experiment, the error-handling ability of the system has been tested and proven. This is a vital feature for a truly automated PAT system with minimal human input. Constant monitoring of the metabolites within the bioreactor is crucial for optimizing the condition of the cells.
Measurements were obtained at fixed intervals throughout the experiment, with the metabolite concentration profiles displayed for glutamine, glutamate, glucose, and lactate in Figure 3.
This rise in sampling frequency, facilitated by automation, allows the changes in metabolite concentrations to be monitored in greater detail.
This increase in sampling frequency also enables more frequent glucose feeding, which inhibits the glucose from deviating too far from the target value of 4000 mg/L. This enables improved control of glucose concentrations and consistency of biologic Critical Quality Attributes (CQAs).
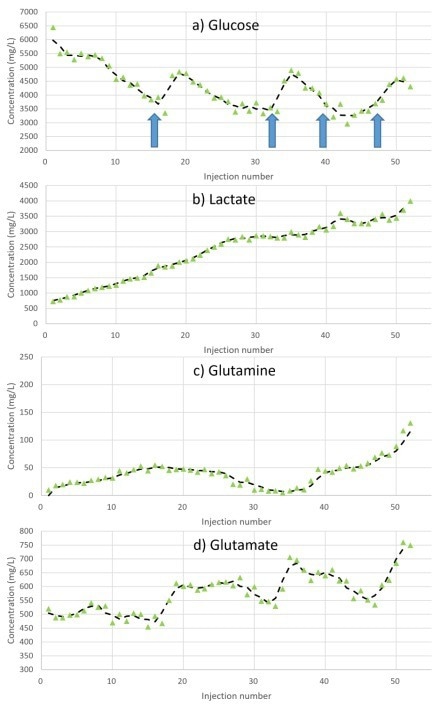
Figure 3. Metabolite concentration profiles during the 10 L cell culture when testing the Microsaic Metabolite Monitoring PAT system. Glucose feeding (large bolus) interventions are shown as arrows. Image Credit: Microsaic Systems plc
Conclusion
This article has discussed the employment of the 4500 MiD®, a low-cost, compact MS, coupled with a HILIC workflow for the automated monitoring of metabolites in upstream bioprocessing.
The compactness of the Microsaic Metabolite Monitoring PAT system allows measurements to be carried out at the point-of-need, outside of centralized laboratories, which enables near real-time monitoring.
The successful demonstration of this PAT tool detailed here provides potentially lower running costs than the photometric assays currently used.
The methodology detailed in this article also has the potential to be used in combination with workflows for monitoring the biologic product CQAs alongside cell culture metabolites.
References and Further Reading
- A Retrospective Evaluation of the Use of Mass Spectrometry in FDA Biologics License Applications, J. Am. Soc. Mass Spectrom. (2017), 28, 786-794.
- Biosimilar, Biobetter, and Next Generation Antibody Characterization by Mass Spectrometry, Anal. Chem. (2012), 84, 4637−4646.
- PAT — A Framework for Innovative Pharmaceutical Development, Manufacturing, and Quality Assurance, Food and Drug Administration, September 2004.

This information has been sourced, reviewed and adapted from materials provided by Microsaic Systems plc.
For more information on this source, please visit Microsaic Systems plc.