In many biological signaling pathways, small and highly charged cations promote structural changes of proteins subsequent to binding. Understanding these structural changes is important to gain a better insight into the regulation of such signaling pathways.
Separate cation-binding motifs are usually preserved between different proteins, although the signaling cascades which are controlled by cation binding are considerably different. "Repeat in Toxin" (RTX) is one type of cation binding motif that is released by pathogenic microorganisms and present on various virulence factors. Aspartate- and glycine-rich domains are sequences of RTX that contain a particular type of Ca2+ binding site.
This binding site is critical for the functioning of secreted toxins, including the adenylatecyclase toxin (CyaA). CyaA toxin has the ability to bind calcium in solution. In order to promote the secretion of these toxins into the extracellular space, their calcium dependence can be leveraged. This is because peptides that are newly produced would have to traverse the constricted channels of the secretion mechanism.
When the concentration of calcium is low within the bacterial cytosol, the RTX motifs would take an unfolded conformation, creating a favorable condition for secretion. But, once in the extracellular medium, the RTX domain would attach to calcium ions and form a structured protein due to higher calcium concentration. Therefore, to distinguish the mechanism of RTX function, a number of biophysical techniques are used to examine the changes in both size and conformation of CyaA’s RTX repeat domain (RD) subsequent to calcium binding.
Molecular Mass and Intrinsic Viscosity Measurements with SEC-TD
After proteins and materials are prepared, GE Healthcare’s Superdex 200 column was used to perform size exclusion chromatography (SEC) experiments. Controlled by a GPCmax module, the Superdex 200 column was linked on-line to a 302 tripledetector array (TDA) from Malvern Panalytical.
The TDA includes the following components:
- A differential viscometer
- A photometer
- A differential refractive index detector
- A static light scattering cell equipped with two photodiode detectors, at 90° for right angle light scattering (RALS) and at 7° for low angle light scattering (LALS)
The refractive index detector and the photometer were used to determine the concentration of protein. The molecular mass ‘M’ was obtained through the LALS and RALS data, along with the concentration. Using the differential viscometer, intrinsic viscosity (η) was determined and using the OmniSEC software both intrinsic viscosity and molecular mass were determined.
Malvern Panalytical’s Zetasizer Nano ZS instrument was used to carry out electrophoretic mobility and zeta potential experiments. This instrument monitors the forward light scattering at 17° angle. Before acquisition, samples and buffers were filtrated on filters of 0.2µm size. Concentrations of RTX polypeptide varied from 70 to 130µM and were diluted in 20mM NaCl, pH 7.4 and 20mM Hepes. Microcuvette ZEN1010 and cuvette DTS1070 were used to obtain the electrophoretic mobility values utilizing the fast field reversal mode. In this mode, 5 to 10 independent measurements were obtained for each sample.
In order to sustain a measurement, the quality criteria were based on the following parameters:
- The quality of the phase plot (frequency and radian amplitude)
- The zeta quality factor
- The mean count rate that should not alter throughout the period of the data acquisition
- The Fourier-transform of the phase plot
Measurements related to satisfactory electrophoretic mobility were averaged and the typical deviation was calculated. The data thus obtained were utilized to produce the distribution of electrophoretic mobility of each state of RCS and RCL.
Nuclear Magnetic Resonance Spectroscopy (NMR), Circular Dichroism (CD), and Analytical Ultracentrifugation (AUC) were other techniques used in this study.
Results and Discussion
Changes were observed in the biophysical properties and protein conformation of repeat domain (RD) subsequent to calcium binding, which were thoroughly examined. Specifically, the combination of SEC and TDA revealed critical data with respect to the peptide behavior. These data are illustrated below.
Formation of Ordered Structures Induced by Binding of Calcium to RD
The data obtained from NMR and Far-UV CD methods indicate that RD sans calcium was present in a disordered state, whilst RD bound to calcium i.e. Holo-RD formed distinctive secondary structures.
To further study these variations, SEC combined with TDA was used on Holo- and Apo-RD, wherein Apo-RD eluted at a retention volume (RV) of 10.4mL which is consistent with a folded protein of about 600kDa. However, Holo-RD eluted at a RV of 13.8mL, which is close to the predicted RV for an appropriately-sized globular protein (Figure 1A and B).
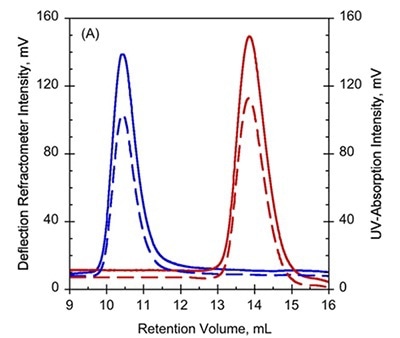
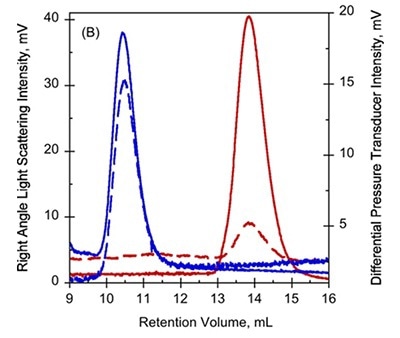
Figure 1. A. UV-absorption (plain curves) and deflection refractometer (dotted curves) chromatograms of apo-RD and holo-RD. B. right angle light scattering (plain curves) and differential pressure chromatograms (dotted curves) of apo-RD and holo-RD.
On the other hand, data obtained from right angle light scattering intensities suggest that the molecular mass did not changed, indicating that the change in RV is not attributed to oligomerization of proteins (Figure 1B). In addition, the sizes of differential viscometer peaks were vastly different between the two states and produced intrinsic viscosity values (η) of 35.1mL.g-1 and 5.5mL.g-1 for Apo-RD and Holo-RD, respectively. This high value for Apo-RD elucidates the low RV, given that RV is associated with hydrodynamic volume.
Further studies using AUC method substantiated that Apo-RD and Holo-RD have different sedimentation coefficients, but same molecular mass of 73kDa. These data also revealed a hydrodynamic radius (RH) of 6.5nm and 3.2nm for Apo-RD and Holo-RD, respectively and demonstrated that subsequent to calcium binding, RD transforms from a disordered peptide structure into a tightly formed peptide having ordered secondary structure.
Characterization of Regions Needed for Calcium Induced Structural Changes
The CyaA’s RD contains about 40 RTX motifs which are arranged into five consecutive blocks, with each block separated by C-terminal and N-terminal flanking regions. A sequence of peptide constructs (Figure 2) were made so as to characterize how these flanking regions contribute to the calcium-dependant structural changes.
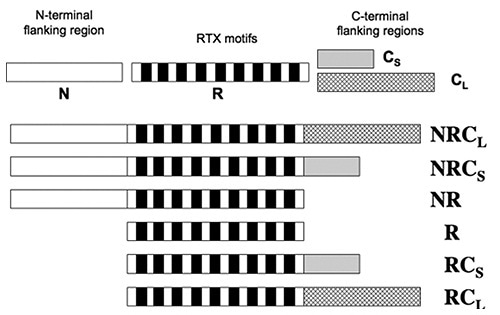
Figure 2
Data obtained from tryptophan fluorescence and CD showed that the presence of calcium did not change the structure of domains R and NR. All constructs comprising the C-terminal flanking regions gained secondary structures subsequent to the addition of calcium. Thus, the N-terminal is no way involved, while the C-terminal regions are required for the formation of secondary structures induced by calcium.
To further study the calcium-induced changes, SEC-TD was used to compare calcium-insensitive (R) and calcium-sensitive (RCL) peptide (Figure 3). Following calcium binding, RCL showed changes in intrinsic viscosity and RV (Figure 3A, C) and this indicated a reduction in the RH. On the other hand, data obtained from the RALS and differential refractometer showed that the molecular mass remained the same for both, and was in agreement with the monomer form.
Contrary to the RCL domain, the R domain showed calcium dependence for all the measured parameters (Figure 3B, D), including RALS, RV, Differential Pressure signal, and Differential Refractometer signal.
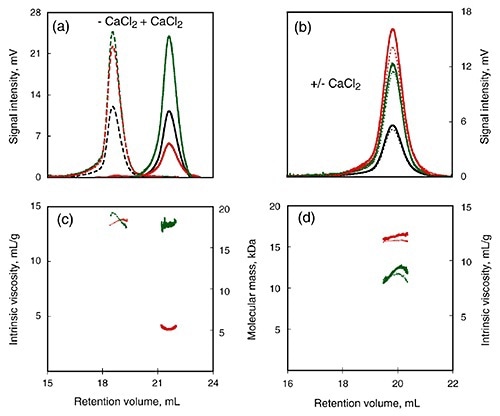
Figure 3
Therefore, the addition of calcium did not yield any significant changes in RH, intrinsic viscosity or molecular mass in the R domain. This supports the conclusion that the C-terminal flanking region plays key role in calcium-induced changes of the domain structure.
Calcium-Induced Formation of Oligomers
The data obtained from AUC method showed that the RH did not change subsequent to calcium binding, whilst data from CD spectroscopy method detected variations in the spectra between Holo-RCS and Apo-RCS. In order to understand these ambiguities, SEC-TD analysis was performed on the RCS domain. Contrary to RCL (Figure 3A, C), RCS remained unchanged in RV subsequent to calcium binding, indicating that Holo-RCS and Apo-RCS exhibit similar hydrodynamic volumes, as shown in Figure 4.
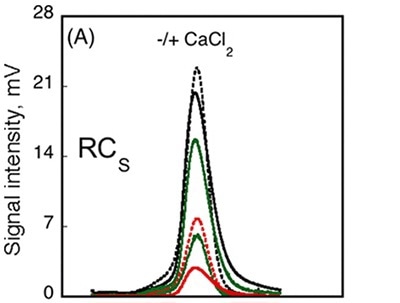
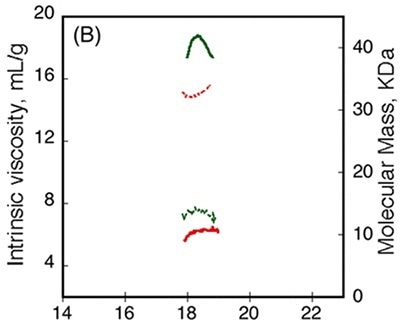
Figure 4
Data obtained from differential refractometer and RALS demonstrated that Apo-RCS and Holo-RCS exhibited a molecular mass of 15.1kDa similar to the monomer, and a molecular mass of 42kDa similar to the formation of a trimer, respectively. The intrinsic viscosity reduced from 14.7 to 6.4mL.g-1 subsequent to calcium binding. All these data suggest the formation of a dense trimer of RCS subsequent to calcium binding.
Conclusion
In order to understand the regulation of signaling pathways, it is important to understand the structural changes induced by cation binding. The above data showed how different types of biophysical techniques can be leveraged to distinguish the changes in size, charge and conformation of protein subsequent to calcium binding.
In particular, the application of SEC-TD helped in explaining the intrinsic viscosity, size and molecular mass of the peptides utilized throughout the study. These data not only helped in identifying the changes promoted by calcium binding, but also assisted in identifying the motifs and domains needed to induce these changes. Also, the application for zeta potential measurements helped in understanding the interactions between peptides and charged ions.

This information has been sourced, reviewed and adapted from materials provided by Malvern Panalytical.
For more information on this source, please visit Malvern Panalytical.