Chromite is an iron chromium oxide mineral (FeCr2O4), which is a source of commercial importance. It contains 68% of chromic oxide (Cr2O3), wherein the proportions of Fe2+, Fe3+, Mg2+, Cr3+ and Al3+ may differ significantly. Chromite produces Ferrochrome, which plays a key role in the steel industry.
The stainless steel industry, in particular, uses over 90% of the global chromite output. In order to improve the grade of the stainless steel production, it is important to evaluate the quality of the chromite ore. Therefore, chemical analyses of the chromite ore, plus its final and waste products is very important.
In metal analysis, ICP-OES or AA is often used to determine the metal contents in industrial products and ores, but the standard dissolution method used for ferrochrome and chromite is a multi-acid digestion process which is laborious, time consuming, and needs the use of HClO4, HNO3 and HF acids.
Therefore, laboratories seek for other alternative methods to achieve complete dissolution of their samples and thus optimize their productivity and uptime. Sodium peroxide fusion provides a safe, fast and efficient alternative for complete dissolution of samples.
Experimental Framework
Sample Preparation
The sodium peroxide fusion method can be carried out both manually or with automatic systems. Here, the automated systems provide a better option as they improve safety, boost productivity, and maintain repeatable preparation conditions.
These factors prevent spattering and cross-contamination. In this study, fusions were carried out by means of a Peroxide Claisse Fluxer® (Figure 1). This instrument is a 6 position gas Fluxer capable of performing multiple and repetitive peroxide fusions with exceptional reproducibility and repeatability.
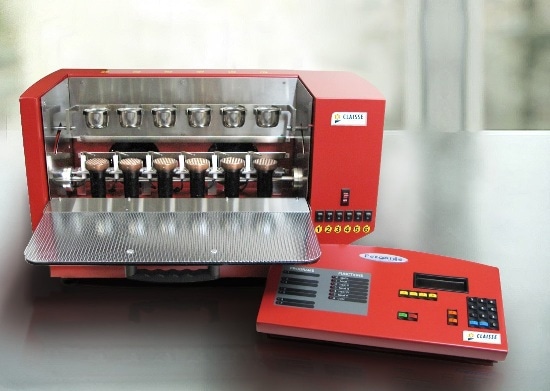
Figure 1. Claisse® Peroxide™ Fluxer
The unique design and finish of the instrument makes it suitable for adverse environment produced by peroxide fusions. The Peroxide™ fluxer integrated with high-stability burners provides stable temperature for controlled fusions. A range of reference materials and samples were utilized to validate the developed method (Table 1).
Table 1. List of reference materials and samples used to validate the developed method
| Sample |
Supplier |
| Certified Reference Material – FeCr (SRM 64c) |
NIST |
| Certified Reference Material - Chromite Ore (SARM 8) |
Mintek |
| Certified Reference Material - FeCr slag (SARM 77) |
Mintek |
| FeCr sample ( # 775 ) |
Mining industry |
| Chromite Ore sample ( # 771 ) |
Mining industry |
| FeCr slag sample ( # 784 ) |
Stainless Steel industry |
In a clean zirconium crucible, 0.2g of finely ground sample measuring less than 100µm was combined with 3.0g of Sodium peroxide (Na2O2) and 0.5g of Sodium Carbonate (Na2CO3). The zirconium crucible was then placed on the Claisse® Peroxide™ Fluxer, fused at 560°C temperature for a period of 3.5 minutes, and then finally cooled by the fluxer fans for 4 minutes. Next, the cooled crucible was placed in a funnel over a 250mL volumetric flask.
Approximately 10mL of warm ultra-filtered deionized water was added to the crucible and this was followed by 25mL of nitric acid (HNO3). The dissolution reaction occurs within a minute at which time the zirconium crucible was tipped over and washed with deionized ultra-filtered water. Then, 25mL of HCl was added to the flask, brought up to volume with diluted acid, and then finally brought to the ICP-OES for analysis.
Instrumentation
The PerkinElmer® Optima™ 7300 DV ICP-OES instrument (Figure 2) was used to perform all the measurements. It is integrated with the WinLab32™ for ICP Version 4.0 software. The ICP torch is positioned in a horizontal direction in the shielded torch box of the instrument which can be seen either radially or axially.
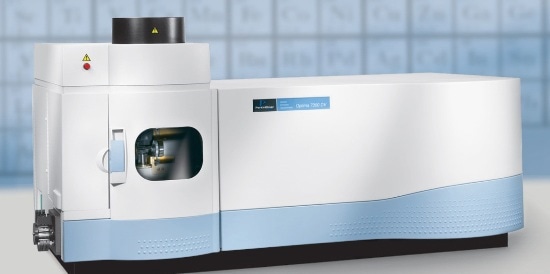
Figure 2. PerkinElmer® Optima™ 7300 DVICP-OES
As an introduction system, a Scott Spray Chamber with a Gem Tip Cross Flow Nebulizer (Figure 3) was chosen as it is capable of handling high dissolved solids and has excellent reliability and robustness. A shear gas flow prevents the cool plasma tail and allows in observing the normal analytical zone of the plasma. This minimizes the effects of chemical matrix when the axial-view mode is used.
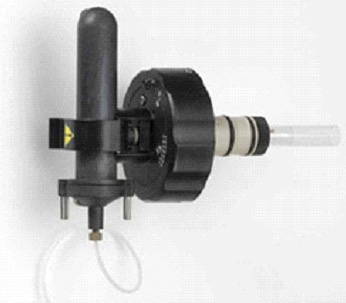
Figure 3. Scott Spray Chamber with Gem Tip Cross Flow Nebulizer
When integrated with an Echelle optical system and a SCD detector, the Optima™ 7300 DV ICP-OES is capable of measuring all the wavelengths at the same time. Thanks to its flexibility, end users can easily include new wavelengths or elements as and when their program changes.
In addition, a 40MHz free-running solid state RF generator has been specifically designed to work from 750 to 1500W in 1W increments. A strong plasma is needed for accurate analysis of fusion samples (Table 2) and for this purpose a high RF power is needed. Table 2 shows the operating parameters for the Optima™ 7300 DV.
Table 2. Optima™ 7300 DV operating parameters
| Nebulizer |
Gem Tip Cross flow |
| Spray Chamber |
Scott |
| Injector |
Alumina |
| RF |
1500 W |
| Argon Flow rate |
Plasma : 16.0 L/min Nebulizer : 0.8 L/min Auxiliary : 0.4 L/min |
| Shear gas |
100 psi |
| Sample flow rate |
1.0 mL/min |
Results and Discussion
The following factors were considered when choosing the wavelength:
- The freedom from spectral interferences
- The different sensitivities and predicted concentration in the samples
To remain in the linear range and to prevent spectral interferences, the most sensitive line is not always utilized. Observed interferences were off-set by changing the processing parameters. Method detection limits (MDLs) were based on 10 replicate measurements of a sequence of diluted sample solutions. The MDL was determined by multiplying the standard deviation of the 10 replicate measurements by 3 as follows:
MDL = 3 x S10 x CDF
Where S10 is the standard deviation of the 10 replicates, and CDF is the Corrected Dilution Factor.
Table 3. Analytes of interest with selected wavelengths, method detection limits (MDLs) and viewing modes
| Element |
Wavelength |
Viewing mode |
MDL ( mg/Kg ) |
| Al |
394,401 |
Axial |
63 |
| Ca |
315,887 |
Axial |
1000 |
| Co |
228,616 |
Axial |
38 |
| Cr |
283,563 |
Radial |
250 |
| Cu |
224,700 |
Axial |
25 |
| Fe |
238,204 |
Radial |
375 |
| Mg |
279,077 |
Radial |
63 |
| Mn |
257,610 |
Radial |
25 |
| Ni |
231,604 |
Axial |
125 |
| P |
178,221 |
Axial |
125 |
| S |
180,669 |
Axial |
625 |
| Si |
212,412 |
Radial |
63 |
| Ti |
334,940 |
Axial |
63 |
| V |
290,880 |
Axial |
5 |
Table 3 shows the relevant analytes with selected wavelengths, viewing modes, and MDLs. The precision and accuracy of the method was then assessed. The precision was ascertained by preparing and quantifying 10 replicates of various certified reference materials (CRMs), while the accuracy was ascertained by measuring the elemental recovery of CRMs.
Tables 4, 5 and 6 present the results obtained for each CRM. The precision and accuracy thus achieved show that the developed method performed exceedingly well.
Table 4. Accuracy and precision measurements on NIST SRM 64c
| Element |
Wavelength |
Average Experimental values ( % ) n = 10 |
Certified values (% ) |
Accuracy ( % ) |
Precision ( % ) |
| Al |
394,401 |
BDL |
- |
- |
- |
| Ca |
315,887 |
BDL |
- |
- |
- |
| Co |
228,616 |
0,05 |
0,05 |
107 |
2 |
| Cr |
283,563 |
69,03 |
68,0 |
102 |
2 |
| Cu |
224,7 |
BQL |
0,005 |
( 60 ) |
( 15 ) |
| Fe |
238,204 |
25,87 |
24,98 |
104 |
3 |
| Mg |
279,077 |
BDL |
- |
- |
- |
| Mn |
257,610 |
0,16 |
0,16 |
101 |
2 |
| Ni |
231,604 |
0,43 |
0,43 |
100 |
2 |
| P |
178,221 |
BQL |
0,02 |
( 86 ) |
( 7 ) |
| S |
180,669 |
BDL |
0,07 |
- |
- |
| Si |
212,412 |
1,28 |
1,22 |
105 |
3 |
| Ti |
334,940 |
BQL |
0,02 |
( 63 ) |
( 5 ) |
| V |
290,880 |
0,15 |
0,15 |
102 |
2 |
In parenthesis and italic = informative values
Corrected dilution factor = 1250
BDL = below detection limit
BQL = below quantification limit
Table 5. Accuracy and precision measurements on Mintek SARM 8
| Element |
Wavelength |
Average Experimental values ( % ) n = 10 |
Certified values ( % ) |
Accuracy ( % ) |
Precision ( % ) |
| Al |
394,401 |
5,81 |
5,56 |
105 |
2 |
| Ca |
315,887 |
BQL |
0,19 |
( 90 ) |
( 18 ) |
| Co |
228,616 |
0,03 |
- |
- |
4 |
| Cr |
283,563 |
35,50 |
33,5 |
106 |
2 |
| Cu |
224,700 |
BDL |
- |
- |
- |
| Fe |
238,204 |
15,20 |
14,13 |
108 |
2 |
| Mg |
279,077 |
8,98 |
8,86 |
101 |
2 |
| Mn |
257,610 |
0,21 |
- |
- |
2 |
| Ni |
231,604 |
0,15 |
- |
- |
3 |
| P |
178,221 |
BDL |
0,004 |
- |
- |
| S |
180,669 |
BDL |
0,03 |
- |
- |
| Si |
212,412 |
2,12 |
2,01 |
106 |
2 |
| Ti |
334,940 |
0,14 |
0,14 |
95 |
2 |
| V |
290,880 |
0,07 |
0,08 |
90 |
2 |
In parenthesis and italic = informative values
Corrected dilution factor = 1250
BDL = below detection limit
BQL = below quantification limit
Table 6. Accuracy and precision measurements on Mintek SARM77
| Element |
Wavelength |
Average Experimental values ( % ) n = 10 |
Certified values ( % ) |
Accuracy ( % ) |
Precision ( % ) |
| Al |
394,401 |
15,34 |
14,55 |
105 |
5 |
| Ca |
315,887 |
2,48 |
2,60 |
95 |
2 |
| Co |
228,616 |
BQL |
- |
- |
( 8 ) |
| Cr |
283,563 |
9,39 |
8,55 |
110 |
3 |
| Cu |
224,700 |
BDL |
- |
- |
- |
| Fe |
238,204 |
5,98 |
5,31 |
113 |
4 |
| Mg |
279,077 |
13,94 |
13,86 |
101 |
2 |
| Mn |
257,610 |
0,16 |
- |
- |
2 |
| Ni |
231,604 |
BQL |
- |
- |
( 7 ) |
| P |
178,221 |
BDL |
- |
- |
- |
| S |
180,669 |
0,17 |
( 0,32 ) |
( 54 ) |
5 |
| Si |
212,412 |
12,81 |
12,5 |
102 |
2 |
| Ti |
334,940 |
0,36 |
- |
- |
1 |
| V |
290,880 |
0,06 |
- |
- |
2 |
In parenthesis and italic = informative values
Corrected dilution factor= 1250
BDL = below detection limit
BQL = below quantification limit
Pre-fusion spikes were then carried out on CRMs and samples (Table 7) to check the elemental recoveries and to further verify the developed method.
Table 7. Recovery results on pre-fusion spikes (n = 5)
| Element |
Wavelength |
#771 ( % ) |
#775 ( % ) |
#784 ( % ) |
SRM 64c ( % ) |
SARM 8 ( % ) |
SARM 77 ( % ) |
| Al |
394,401 |
101 |
96 |
109 |
101 |
99 |
92 |
| Ca |
315,887 |
96 |
109 |
99 |
114 |
97 |
112 |
| Co |
228,616 |
103 |
101 |
99 |
98 |
102 |
100 |
| Cr |
283,563 |
107 |
105 |
107 |
107 |
108 |
103 |
| Cu |
224,700 |
99 |
89 |
94 |
99 |
101 |
98 |
| Fe |
238,204 |
110 |
107 |
108 |
107 |
103 |
101 |
| Mg |
279,077 |
102 |
97 |
94 |
91 |
94 |
93 |
| Mn |
257,610 |
105 |
104 |
108 |
105 |
107 |
110 |
| Ni |
231,604 |
109 |
112 |
110 |
96 |
102 |
100 |
| P |
178,221 |
114 |
57 |
113 |
96 |
84 |
106 |
| S |
180,669 |
97 |
95 |
107 |
110 |
66 |
86 |
| Si |
212,412 |
102 |
53 |
106 |
91 |
105 |
91 |
| Ti |
334,940 |
107 |
105 |
106 |
105 |
103 |
102 |
| V |
290,880 |
105 |
105 |
105 |
99 |
103 |
97 |
Comments:
• Spike concentration = 50 to 100 % more than the concentrations in the samples and CRM solutions (Corrected dilution factor : 2500 ).
• If concentrations < MDL, addition of ±10 times the MDL value.
Conclusion
Peroxide fusions in tandem with the Optima™ 7300 DV (simultaneous ICP- OES) have the required analytical capabilities to carry out the analysis of ferrochrome, chromium slag, and chromite ore samples with excellent precision, accuracy, and speed of analysis.
The analytical method is not only robust, but also meets the requirements specified for analysis of fusion and other high matrix samples. Metal components determined at high and low concentrations in various reference materials and samples show excellent accuracy. Thus, the sodium peroxide fusion method provides a suitable alternative to other acid digestions that are complex, incomplete, and takes considerable amount of time.

This information has been sourced, reviewed and adapted from materials provided by Claisse.
For more information on this source, please visit Claisse.