Sponsored by m-oemJul 15 2015
Raman Spectroscopy is a versatile analytical technique designed for molecular structure measurement and identification of chemical composition of materials based on the vibrational and rotational modes of a molecule.
The standard probe of the i-Raman Plus series has a spectral range focusing on the fingerprint region ranging from 176cm-1-4000cm-1.
Combined with an optimized optical design and advanced technology, the B&W Tek BAC102 series E-grade probe can access frequency modes as low as 65cm-1, thereby delivering an inexpensive solution for full range measurements. Both the fingerprint region and the low frequency Stokes transitions for L-asparagine are shown in Figure 1. It is evident that three dominant bands exist below 200cm- 1. Furthermore, the ability to access lower frequency regions delivers important information for applications, including polymorph detection and identification, material phase and structure determination and protein characterization.
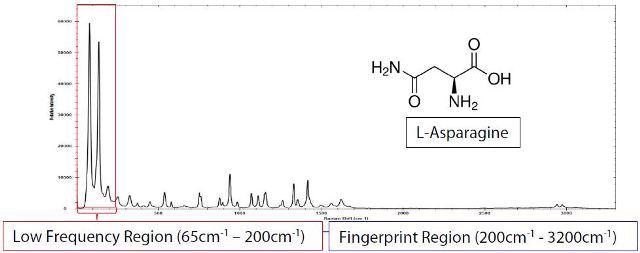
Figure 1. The i-Raman Plus 785nm system using an E-grade probe was used to collect the low frequency spectra of L- Asparagine with a total integration time of 1200ms
Experimental Procedure
Low Frequency Raman Instrumentation
B&W Tek’s i-Raman Plus portable Raman spectrometer was used for sample measurement (Figure 2). It employs a patented CleanLaze® 785nm laser excitation with maximum power output of 300mW and linewidth of below 0.2nm. The system features a sensitive TE cooled back-thinned CCD and is attached to a BAC 102 E-grade probe (Figure 3) using proprietary technology, covering a spectral range of 65-3200cm-1 with a spectral resolution of 4.5cm-1. Using 300mW laser power, the Raman spectra were acquired at room temperature. The integration time was between 100ms to 10s.
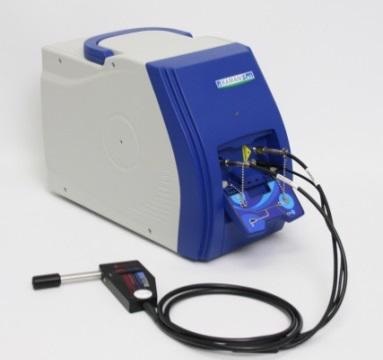
Figure 2. The i-Raman Plus portable Raman spectrometer
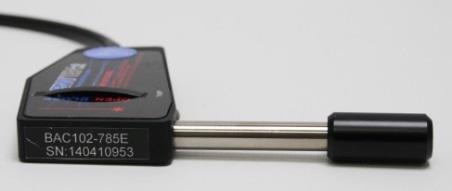
Figure 3. The BAC 102 E-grade probe
Polymorph Detection
Determining the structural form of active pharmaceutical ingredients (API) is of high importance to the pharmaceutical industry during drug development, manufacturing and quality control. APIs exhibit polymorphism that are characterized to have identical chemical compositions but varying solid-state structures that tend to affect the bioavailability and therapeutic index. The use of a wrong form could result in compromising the efficacy of the final product. Pseudo- polymorphs are also available, which include solvents suspended in a lattice structure. Figure 4 illustrates the pseudo-polymorph D-glucose example and the ability of the E-grade probe to determine the differences between the hydrate form and crystalline structures at less than 200cm-1 frequency. The inclusion of the low frequency region improves the detection sensitivity and the ability to discern between similar materials.
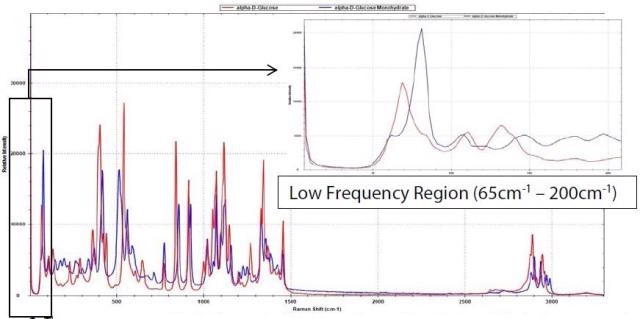
Figure 4. The Raman spectra of α-D-Glucose (red) and α-D-Glucose Monohydrate (blue) using 10s integration time. Note the significant difference between the two pseudo- polymorphs within the low frequency range of 65cm-1 to 200cm-1.
Monitoring Phase Change
Monitoring phase changes or crystallization of chemical processes is another key industrial application. Figure 5 shows an example, which uses sulfur to illustrate the ability of the E-grade probe to monitor phase changes. A solid a- Sulfur sample was deposited onto an aluminum tray, which is then heated using a hot plate. The Raman spectra were obtained using the low frequency E-grade probe coupled to the i-Raman Plus at 100% laser power (~300mW) and 100ms integration time for both the solid and liquid phase. When the sample was heated to 115.2C°, which is beyond its melting point, the low frequency peak at 83.6cm-1 is expanded and shifted. This represents the shift from the a form to the α form. No changes were observed within the fingerprint region.
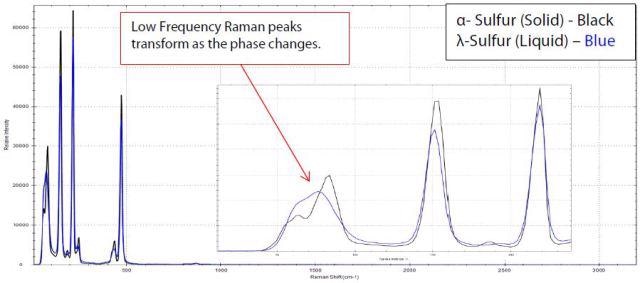
Figure 5. The Raman spectra of Sulfur transitioning from the a-crystalline form to the λ- liquid form using 100ms integration time. Note the significant broadening in the peaks located in the low frequency region between 65cm-1 to 200cm-1.
Conclusion
For applications that demand low frequency detection down to 65cm-1, the combination of the i-Raman Plus 785nm Raman spectrometer and the low frequency E-grade probe is an ideal choice. Further, the ability of the spectrometer to analyze polymorphs and solvate forms enables efficient control of the manufacturing and formulation procedures in the biological and pharmaceutical industries. Besides protein, polymorph and phase characterization, semiconductor lattices, solar cells, carbon nanotubes and a range of minerals, gemstones, and pigments can also be characterized using low frequency Raman spectroscopy.

This information has been sourced, reviewed and adapted from materials provided by B&W Tek.
For more information on this source, please visit B&W Tek.