Manufacturers need to thoroughly understand the tendency of samples to aggregate in order to make effective biopharmaceutical formulations.
Aggregation is not preferred in biologic drugs as:
- Aggregation reduces the active ingredient content in the sample, resulting in a reduction in efficacy
- Aggregation triggers immunogenic responses in the body.
Triggering of immunogenic responses results in rapid clearance of the drug, leading to a reduction in efficacy or even severe immune responses in some patients. Therefore, protein drug samples need to be characterized to develop effective formulations and to characterize final products. This requires a method for the measurement, identification and characterization of various protein aggregate components.
Conventionally, such information is obtained using size exclusion chromatography (SEC) techniques, where the identification of sample components is based on molecular weights. The identification of components is executed by comparing the retention volume of the analyte molecules with a series of standards of known molecular weights using a size exclusion column.
By recording the elution using a concentration detector and with known relevant extinction coefficients, the relative proportions of each component can be obtained from their respective peak areas.
Despite the extensive use of a column calibration SEC technique for characterizing proteins, the evaluation of molecular weights based on this technique has its limitations. Some of the issues with this method are: inaccuracies in analyzes due to shape-dependent elution.
This article describes the use of the column calibration and multi-detection SEC for characterizing two antibody samples.
The results of both these methods and a demonstration of the capability of multi-detection SEC, which is a combination of the resolving ability of chromatography and the revealing ability of a viscometer and light scattering detectors, is provided here.
The light scattering detectors in the multi-detection SEC system quantify the absolute molecular weight whilst a column calibration system is capable of providing relative measurements only. Information relating to the molecular structure of the protein under analysis is provided with the differential viscometer. A more comprehensive characterization of the protein mixtures under analysis can be achieved based on the highly accurate data provided by the multi-detection SEC method.
Materials and Methods
The protein molecular weight marker kit contained an exclusion marker prepared in phosphate buffered saline (PBS) of pH 7.4 at final concentrations of roughly 1-3 mg/mL and six globular proteins. Two polyclonal immunoglobulin G samples (IgG) derived from different sources were also prepared in PBS at final concentrations of 2-3 mg/mL.
A cellulose acetate membrane of thickness 0.2 µm was used for filtering the samples, followed by the application of three replicate injections of 100 µL to the size exclusion column set consisting of two Viscotek P3000 columns. The zero-waste mode was chosen for volume-economic delivery of sample. The OMNISEC system was used for measurements under the following conditions:
- Flow rate – 1 mL per minute
- Mobile phase – phosphate buffered saline
- Column compartment at 25 °C
- Detector compartment at 25 °C
Results and Discussion
IgG Chromatograms: Ultraviolet Absorbance
The ultraviolet (UV) absorbance detector was used for monitoring the elution profiles of IgG samples (Figure 1).
The qualitative comparison of samples and detection of the marginal differences in their relative composition was achieved by overlaying the two chromatograms.
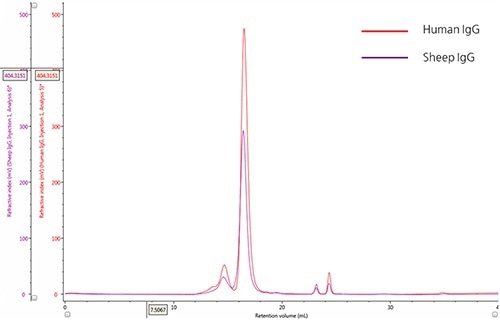
Figure 1. Overlay of representative UV chromatograms of human IgG (red) and sheep IgG (purple).
A significant peak with retention volume (VR) at roughly 16.0 mL, and the presence of many species at lower retention volumes are observed from the chromatograms of both the samples. Using size exclusion theory it can be concluded that the upstream peaks from the major peak are due to species that have an increasingly larger hydrodynamic radius, which could mostly be IgG monomer aggregates. The minor peaks present downstream of the major peak (having an approximate VR of 24 mL), are caused by small hydrodynamic radii and are most probably salt molecules.
Characterization of IgG Samples by SEC Column Calibration
Characterization was done by plotting the log of the molecular weight (Log Mw) of each protein as a function of protein retention volume to the column void volume (Vo). To estimate the molecular weight values for peaks present in chromatograms of both the samples calibration parameters were derived from the linear fit of the data. (Figure 2).
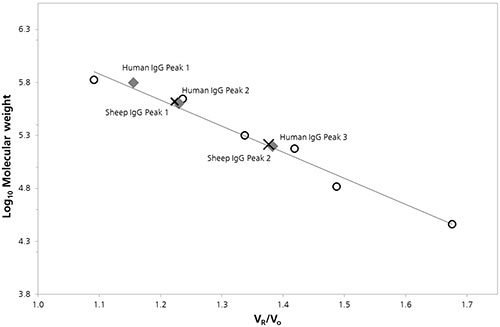
Figure 2. SEC Column calibration curve with sheep (cross) and human (diamond) IgG data superimposed.
The estimated Mw values and other quantitative properties that were detected by column calibration are listed in Table 1.
Table 1. Summary of results from SEC column calibration.
| |
Human IgG |
Sheep IgG |
| Peak 1 |
Peak 2 |
Peak 3 |
Peak 4 |
Peak 1 |
Peak 2 |
Peak 3 |
| VR (mL) |
> 13.00 |
13.80 |
14.69 |
16.51 |
>13.80 |
14.60 |
16.44 |
| Mw (kDa) |
- |
627.2 |
398.9 |
158.1 |
- |
417.6 |
163.8 |
| Identity |
higher
order
aggregate |
trimer |
n/d |
monomer |
higher
order
aggregate |
n/d |
monomer |
In the 150 kDa region, antibody monomers exhibit nominal molecular weight. The predicted Mw for Peak 3 for humans, and Peak 2 for sheep, can be observed from the column calibration data, which most probably relates to the monomer species. However, these peak values are marginally higher than the nominal molecular weights, at 158.1 and 163.8 kDa respectively. Furthermore at lower retention volumes, Peak 1 for sheep 14.60 mL and peak 2 for humans 14.69 mL, do not correspond to dimer or trimer masses, which does not support a definitive identification. Additionally, the estimated molecular weight of Peak 1 for humans may correlate to the tetramer mass of 632.4 kDa.
Characterization of IgG Samples by Chromatography Coupled Multi-Detection
In this analysis, the same sample set (IgG) was analyzed using the multi-detector SEC and the corresponding quantitative properties of human and sheep IgG samples are listed in Table 2.
Table 2. Summary of the results from multi-detector SEC.
| |
Human IgG |
Sheep IgG |
| Peak 1 |
Peak 2 |
Peak 3 |
Peak 4 |
Peak 1 |
Peak 2 |
Peak 3 |
| Mw (kDa) |
722.8 |
459.0 |
299.5 |
147.5 |
551.7 |
306.7 |
152.0 |
| Mw/Mn |
1.0334 |
1.0008 |
1.0002 |
1.0002 |
1.0697 |
1.0010 |
1.0002 |
| Rh (nm) |
11.0 |
8.2 |
6.7 |
4.8 |
8.8 |
6.8 |
5.0 |
| IV (dL/g) |
0.159 |
0.086 |
0.068 |
0.049 |
0.097 |
0.064 |
0.051 |
| Identity |
higher
order
aggregate |
trimer |
dimmer |
monomer |
higher
order
aggregate |
dimmer |
monomer |
| % Composition |
1.3 |
2.4 |
11.4 |
84.9 |
2.8 |
11.6 |
85.6 |
It was observed that the absolute Mw values for human IgG peaks 1-3 corresponded to the expected values for trimer, dimer and monomer species and the respective Mw values obtained for IgG peaks 1, 2 were in sync with dimer and monomer species. The viscometer provided additional information that was used to measure the hydrodynamic radii of the IgG monomers and compare these values.
Based on the comparison, the respective elution order of the two molecules was rationalized, revealing that the IgG (human) monomer is smaller (Rh= 4.8 nm) and as a result eluted a little later than the IgG (sheep) monomer. The points located upstream of the dimer and trimer peaks (RV<14.0 mL) generate signals that correspond to molecules having increasingly higher molecular weights, which is most probably a result of higher order aggregates (Figure 3).
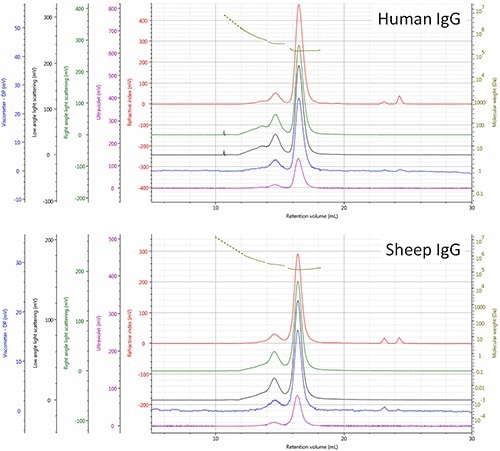
Figure 3. Multi-detector SEC chromatograms of human and sheep IgG samples - refractive index (red), right angle light scattering (green), low angle light scattering (black), viscometer (blue), ultra violet (purple). The molecular weight of species is shown in olive.
The relatively high polydispersity (Mw/Mn) of these molecules 1.0334 for human and 1.0697 for sheep mixtures reiterates the above observation. As per the above observations, differences in aggregate composition of the two IgG samples are evident. Additionally, the presence of a substantial trimer population was observed in the human and not in sheep sample, which suggests differences in the routes or stability of aggregation of the sheep sample that needs to be investigated further.
Shape-Dependent Inaccuracies in Column Calibration SEC
Based on the data obtained from column calibration and multi-detector SEC analyzes, it was seen that the Mw values from the former were higher than the latter. The Mw values corresponding to the peaks relating to the monomer in both analyzes help identify the monomer species. In case of aggregate peaks, such as the dimer, accurate identification is not possible because of the deviation of Mw values from the expected values of 28%.
Such errors in the column calibration method could be caused due to the effect of the shape on the elution of antibody molecules and their aggregates via the column matrix. The multi-detection method is however, devoid of such errors.
The column permeation attributes of a protein molecule depend on the hydrodynamic volume, as per the size exclusion theory. Due to the dependency of the hydrodynamic volume on both the structure and mass, the hydrodynamic value of a protein with a specific molecular weight may either be equal to or lesser than the hydrodynamic value of a protein with a lower molecular weight. This is because the latter is less densely packed and bears an elongated structure.
Effectively, the slopes of the constructed calibration curves of these molecules with different shapes would also be different. Implementing the standard method of using globular proteins in column calibration implies the assumption of globular shapes onto the samples as well. However, since the antibody bears a Y-shape and not a globular structure use of the standard method results in overestimation and inaccurate Mw values as the molecular size increases.
Conclusion
The performance of the column calibration and multi-detector SEC methods was compared by analyzing two different IgG samples. The analysis results of the SEC method allow conclusively designate the discrete peaks to specific oligomeric states, and help distinguish and quantify the variations in the aggregation states between the two samples. Based on the analysis data, biopharmaceutical manufacturers are able to recognize and comprehend the behavioral attributes of various candidates under various conditions or in formulations. The understanding and control of the production and efficacy of such formulations is may be improved based on the above results.
The Malvern Panalytical OMNISEC system is a highly sensitive system using which even a few µg or lesser quantities of sample can be measured. The system is extremely economic in handling samples since the autosampler eliminates sample wastage. Additionally, the samples are maintained at cool temperatures before measurements are taken, thereby, preventing aggregation during the wait time. In view of the above benefits of using the OMNISEC system, it is considered as a valuable system for accurate characterization of proteins and biopharmaceuticals.

This information has been sourced, reviewed and adapted from materials provided by Malvern Panalytical.
For more information on this source, please visit Malvern Panalytical.