Sponsored by m-oemDec 2 2016
The diffraction grating of a spectrometer partially determines the optical resolution that can be achieved by the spectrometer and also determines the wavelength range. Selecting the correct grating is an important factor to optimize a spectrometer to obtain the best spectral results for the application.
Gratings will have an impact on optical resolution and the maximum efficiency for a particular wavelength range. There are two parts in the grating, the blaze angle and groove frequency, both of which are explained in detail in the following sections.
There are two types of diffraction gratings – holographic gratings and ruled gratings. Ruled gratings are developed by etching several parallel grooves onto the surface of a substrate and then coating it with a highly reflective material.
Holographic gratings are developed by interfering two UV beams to create a sinusoidal index of refraction variation in a piece of optical glass. This technique provides a more uniform spectral response, but a considerably lower overall efficiency.
Although ruled gratings are the simplest and cheapest gratings to manufacture, they exhibit much more stray light, which is caused by surface imperfections and other errors in the groove period. So, holographic gratings are usually chosen to improve the stray light performance in spectroscopic applications (such as UV spectroscopy) where the detector response is poorer and the optics is suffering severe loss.
Another benefit of holographic gratings is that they are easily formed on concave surfaces, allowing them to operate as both the focusing optic and the dispersive element simultaneously.
Groove Frequency
The amount of grooves per mm ruled into the grating determines the amount of dispersion. This is commonly known as groove frequency or groove density. The spectrometer’s wavelength coverage is determined by the groove frequency of the grating, which is also a key factor in the spectral resolution.
The wavelength coverage of a spectrometer is inversely proportional to the dispersion of the grating due to its fixed geometry. However, the higher the dispersion, the higher the resolving power of the spectrometer. On the other hand, decreasing the groove frequency decreases the dispersion and increases wavelength coverage at the cost of spectral resolution.
For instance, if an Exemplar™ spectrometer with a 900 g/mm was selected, it would provide a wavelength range of 370 nm, with an optical resolution as low as 0.5 nm. Similarly, if an Exemplar™ with a 600 g/mm grating were to be chosen, it would provide up to 700 nm of wavelength coverage with an optical resolution as low as 1.0 nm.
As can be seen from this example, the wavelength coverage can be increased at the sacrifice of optical resolution.
Optical signals in wavelengths from different diffraction orders may end up at the same spatial position on the detector plane when the required wavelength coverage is broad, i.e. λmax > 2λmin. This will become evident when looking at the grating equation. In this case, a linear variable filter (LVF) is needed to perform “order sorting” or eliminating any unwanted higher order contributions.
For fixed grating spectrometers, it can be shown that the angular dispersion from the grating is described by
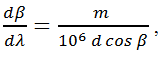 |
Equation (1) |
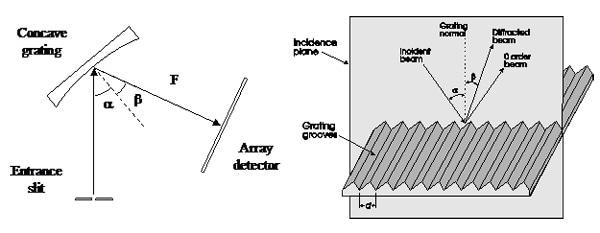
where d is the groove period (which is equal to the inverse of the groove density), Beta is the diffraction angle, m is the diffraction order, and λ is the wavelength of light as can be seen in Figure 1.
Considering the focal length (F) of the focusing mirror and by assuming the small angle approximation, Equation 1 can be rewritten as
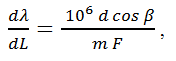 |
Equation (2) |
which provides the linear dispersion in terms of nm/mm. From the linear dispersion, the maximum spectral range (λmax - λmin) can be calculated based on the detector length (LD). This detector length can be calculated by multiplying the total numbers of pixels on the detector (n) and the pixel width (Wp) resulting in the expression
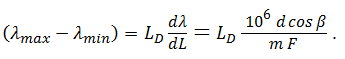 |
Equation (3) |
From Equation 3, it is clear that the maximum spectral range of a spectrometer is determined by the groove density (1/d), the focal length (F), and the detector length (LD). The minimum wavelength difference that can be resolved by the diffraction grating is provided by the following equation:
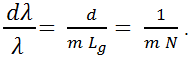 |
Equation (4) |
where N represents the total number of grooves on the diffraction grating. This is consistent with the transform limit theory which states that the smallest resolvable unit of any transform is inversely proportional to the number of samples. Typically, the resolving power of the grating is considerably higher than the overall resolving power of the spectrometer, demonstrating that dispersion is only one of the several factors that determine the overall spectral resolution.
It must be noted that the longest wavelength to be diffracted by a grating is 2d, placing an upper limit on the spectral range of the grating. This long wavelength limitation may restrict the maximum groove density allowed in a spectrometer, for near-infrared (NIR) applications.
Blaze Angle
As a grating diffracts incident polychromatic light, it doesn't do so with uniform efficiency. The groove facet angle, also known as the blaze angle, determines the overall shape of the diffraction curve. With this property, it is possible to calculate which blaze angle will correspond to which peak efficiency; this is known as the blaze wavelength. Figure 2 illustrates this concept and compares three different 150 g/mm gratings blazed at 500 nm, 1250 nm, and 2000 nm.
Gratings can be blazed to provide high diffraction efficiency (>85%) at a specific wavelength, i.e. a blaze wavelength (λB). As a rule of thumb, the grating efficiency will decrease by 50% at 0.6 xλB and 1.8 xλB. This sets a limit on the spectral coverage of the spectrometer. Typically, to improve the overall signal to noise ratio (SNR) of the spectrometer, the blaze wavelength of the diffraction grating is biased toward the weak side of the spectral range.
This information has been sourced, reviewed and adapted from materials provided by B&W Tek.
For more information on this source, please visit B&W Tek.