It is not an easy task to measure to the nanometer scale—achieving it requires careful engineering and a stable sensor. The sensors employed for stage position feedback within semiconductor lithography tools achieve this level of precision on a regular basis; to satisfy this application, ZYGO has delivered displacement measuring interferometers (DMIs) for three decades. This experience has given the company a better understanding of all the considerations needed to reliably accomplish subnanometer precision.
ZPS, the latest product from ZYGO, is an optical sensor system that offers absolute position with subnanometer precision. Today, a large number of sensors are available in the market which all claim to have this capacity—but without industry-standard definitions, it is hard to compare two entirely different sensors and understand their relative performance. This article discusses about ZYGO’s experience, explains the common terms that describe the quality of a position sensor, and demonstrates how ZPS delivers exceptional performance using ZYGO’s patented technologies.1
The ZPS system is a fiber-based interferometer sensor which delivers absolute position with high repeatability (0.5 nm 3σ) and low noise (≤0.02 nm/√Hz) over a 1.2 mm travel range. Up to 64 synchronized channels along with user-selectable data rates up to 208 kHz are supported by the system. It is best suited for applications that demand a large number (>16) of measurement channels or require the highest quality of measurement.
How to Align a ZPS™ Sensor
Many advantages are provided by optical sensors when compared to other technologies like encoders or capacitance gauges. Optical sensors are insensitive to electromagnetic interference, are capable of direct measurements, and do not produce any heat. Since fiber cables can be relatively long and are more flexible than electrical cables, there are only minimal cabling restrictions. Being highly compact, (3 × 27 mm), ZPS sensors allow metrology in applications with severe space constraints.
How ZPS Works
ZPS integrates three types of interferometry in one device: heterodyne, multiwavelength, and coupled-cavity interferometry (see Figure 1).
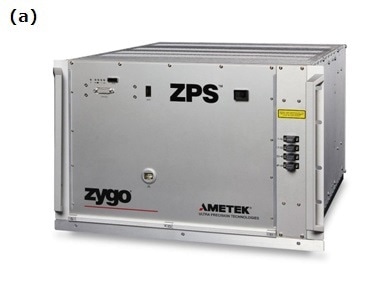
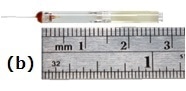
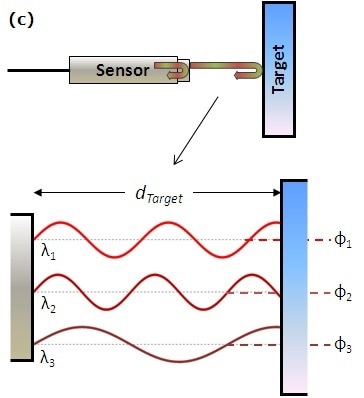
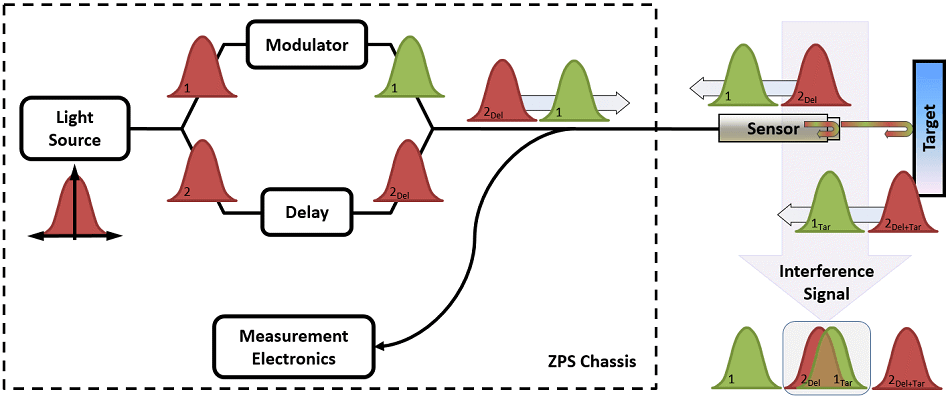
Figure 1. The chassis (a) and sensor (b) are shown for a ZPS absolute-position sensor; the sensor is based on multiwavelength (c), heterodyne, and coupled cavity interferometry (d).
Multiwavelength interferometry is a method of reconstructing absolute distance between two surfaces by solving several instances of the equation, 2d = mλ + φ, where d represents the distance between the target and the sensor reference surface, φ is the fractional (residual) interference term, and λ is wavelength. These equations can be solved using the Method of Exact Fractions, developed in 1898 by Jean-René Benoît.
Multiwavelength interferometry allows the ZPS system to measure the actual distance between the target and the sensor. ZPS carries out this method by employing three known wavelengths, measuring the residual interference terms and subsequently solving for m and d. The algorithms of ZPS result in a ≤ 0.5 nm 3σ repeatability. The absolute distance is measured on all channels simultaneously in a calibration step which takes approximately one second; heterodyne displacement interferometry is used thereafter to track the changes in the position.
Two frequencies of light are used in heterodyne interferometry to produce a constant signal due to temporal interference. The idea is similar to FM radio, in which a carrier frequency is modulated to transmit information, leading to a lower noise floor and improved performance. This is the reason why music sounds better on FM radio; position interferometry also produces better results using this technique. To generate the carrier frequency, ZPS employs an electro-optic modulator.
In order to measure displacement over short distances, coupled-cavity interferometers are employed in combination with low-coherence light sources. The nominal zero point of the measurement arm of the interferometer is determined by a reference cavity. The ZPS uses this architecture by introducing a delay between the unmodulated and modulated light. The nominal standoff between the target and the sensor is set by this path delay; changes to this path delay would manifest as apparent motion in the target. A thermally stabilized cavity within the system tracks changes in the path delay and removes this error source from the data in real time.
The key performance specifications for ZPS are shown in the table—a few of these terms are usually published by all sensor manufacturers. Resolution is typically considered to be the indicator of a performance and the metric by which several options are compared. Unfortunately, this number indicates different things depending on the company publishing it. As usual, the devil is in the details and it is essential to read the fine print to realize what any of these specifications say about the sensor’s performance.
Specifications
| . |
. |
| Measurement Channels |
Up to 64 |
| Working Distance |
3.5 mm |
| Noise Density (3σ) |
0.02 nm/√Hz |
| Stability |
1 nm / day |
| Non-linearity |
± 1 nm |
| Repeatability (3σ) |
0.5 nm |
| Digital Resolution |
0.01 nm |
| Max. Data Rate |
208 kHz |
What Resolution Means
Resolution is probably the most misunderstood term used for describing the performance of a sensor. In certain cases, resolution is only the smallest counting increment from the device—the noise floor may be orders of magnitude higher. In other cases, resolution includes noise but either hides it in very fine print or fails to specify the bandwidth. Rolling averages and low bandwidths trade dynamic response for better resolution. If it is not explicitly stated, it is essential to ask the supplier the bandwidth at which the resolution is specified in order to understand the true performance of the sensor.
The term digital resolution is used by ZYGO to indicate the smallest counting increment available. This number should be below the noise floor (but not too far) to resolve the sensor’s noise-limited performance. With ZPS, ZYGO specifies a bandwidth-independent noise (0.02 nm/√Hz), the digital resolution (0.01 nm), and the maximum bandwidth (104 kHz). All these specifications can be obtained at the same time.
Beyond the resolution and noise consideration, there are other sources of error in sensors that some companies that are less than direct about. All these sources can be combined to form a total measurement uncertainty number which really speaks to actual performance expectations of a sensor in a particular application. ZYGO is aware about the total measurement uncertainty of our products and shares this insight with the customers.
Defining Sensor Performance
The total uncertainty of a sensor system is the actual measure of its performance. Understanding uncertainty can be quite complex, even a graduate-level college course unto itself. The main goal of an uncertainty analysis is to integrate all the potential sources of errors statistically to create a standard deviation. A thorough overview of the process is provided by ISO’s Guide to the Expression of Uncertainty in Measurement (also called the GUM).2
Aside from noise, the main sources of uncertainty for position sensors are nonlinearity, environmental effects, mounting, and stability of length scale.
Bob Hocken, Distinguished Professor at the University of North Carolina Charlotte and former director of the Center for Nanoprecision Metrology and, once said that, “Every machine I ever made was also a thermometer.” Therefore, it is no surprise that sensor behavior is affected by temperature changes. In addition, any noncontact sensor must also account for gas content, humidity, and pressure when operating outside of a vacuum. A refractometer accessory in ZPS detects the air’s actual refractive index, and automatically offsets sensor measurement values versus environmental effects in real time to subnanometer levels.
Each sensor technology comes with its own sources of nonlinearity. With regard to interferometers, this usually comes from false reflections and displays itself as a sinusoidal error in the data, earning it the term cyclic error. In the case of other sensor technologies, nonlinearity may arise from the limits of the factory calibration. It is essential to know that these errors exist and what their magnitude is. ZPS deals with sources of nonlinearity through a patented active compensation process for cyclic error and by factory calibration for low-order terms. The outcome is a low residual nonlinearity of less than ±1 nm.
To achieve low uncertainty, the stability of a sensor’s length scale is an important consideration. The wavelength of light used in the measurement is the length scale for interferometer systems. By using thermally controlled cavities inside the chassis, ZPS actively tracks the changes in wavelength and automatically applies compensation to the data for any measured changes. ZPS’s specification for sability is ≤1 nm/day; qualification data reveals actual performance to be considerably better.
Designers who are new to the challenges of precision metrology usually do not consider the importance of sensor mounting. Irrespective of the technology used, motion of the sensor mount is impossible to differentiate from motion of the target. Therefore, the reference surface of the sensor should be identified and its location should be kept fixed over the expected vibration and thermal ranges. The reference surface of ZPS is located on the front face of the sensor, enabling the design of a tight metrology loop. In other sensors, there are ill-defined or buried inside the sensor package. This adds more uncertainty to the setup and makes it more complicated to develop good metrology.
ZPS Performance
In spite of all the challenges, it is still possible to achieve nanometer-level metrology performance. The graphs shown in the following figure demonstrate example data of actual ZPS performance.
Shown below are descriptions of the test conditions.
Stability: ZYGO measures system stability using air-spaced Zerodur cavities in a typical laboratory environment (±0.5 °C). Environmental compensation is applied using the refractometer accessory. In order to separate the stability measurement from noise, each data point indicates an average over one second. The result is <0.2 nm drift over a period of four days.
Nonlinearity: ZPS data is collected at the same time against a standard helium neon laser-based DMI system. As shown in the graph, the bounds of the cyclic error are added to the measured low-order effects. Low-order nonlinearity originates from the phase change as the target moves through the focal point of the beam. The resulting nonlinearity is ≤±0.4 nm across the full measurement range.
Noise: Solid-glass etalons are used in this measurement to remove mechanical vibrations. The measurements were taken in a nominal laboratory setting at 5 kHz and subsequently transformed into a bandwidth-independent noise figure. ZPS features a tiered specification, where the central ±100 µm range has 4x lower noise specification.
Repeatability: Absolute distance is established by the calibration routine, run repeatedly over the course of quite a few hours. Mechanical noise is eliminated using air-spaced Zerodur etalons; the measurement is performed on several of these etalons simultaneously. The demonstrated result is well below the 0.5 nm 3σ specification.
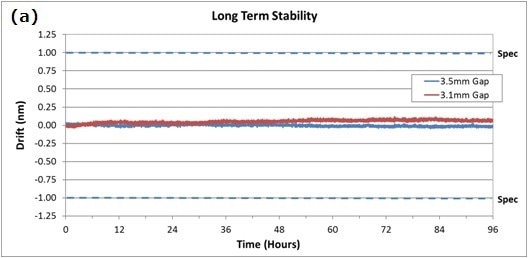
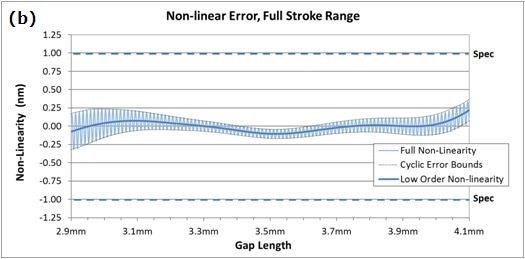
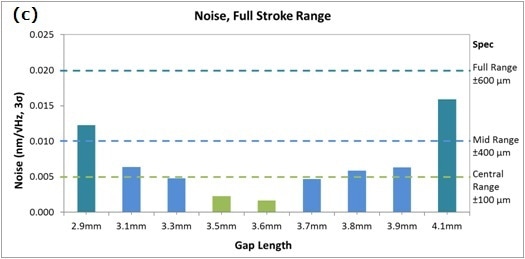
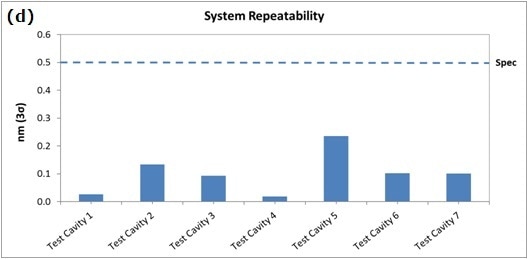
Figure 2. Graphs of performance data from the ZPS sensor show long-term stability (a); nonlinear error, full-stroke range (b); noise, full-stroke range (c); and system repeatability (d).
Summary
With a thorough understanding of uncertainty, it becomes much easier to compare sensors even when they use different technologies. ZYGO’s extensive precision metrology experience enables design and production of high-quality position sensors like ZPS to address the uncertainty requirements of various applications.
References
1. See U.S. patents 7,636,166; 7,639,367; 7,826,064; and 9,115,975.
2. See www.bipm.org/en/publications/guides.

This information has been sourced, reviewed and adapted from materials provided by Zygo Corporation.
For more information on this source, please visit Zygo Corporation.