Water and alcohol (ethanol) are the two main ingredients in alcoholic beverages and the alcohol content must be displayed on the label. Alcohol content can be easily measured using ATR-FTIR spectroscopy.
Multiple reflection ATR spectroscopy was once very popular for a wide range of spectroscopic measurements but was recently almost completely replaced by single reflection ATR. Although single reflection ATR is particularly well suited for studying powders and solids, multiple reflection ATR, with its higher effective pathlength, is a superior method for the analysis of liquids in majority of cases.
This article investigates the use of multiple reflection diamond ATR spectroscopy for the analysis of ethanol content in alcoholic beverages. It also investigates whether a reduced set of prepared ethanol-water solutions with known ethanol content could be used as standards for the PLS-based chemometric procedure instead of the more widely used set of standards prepared from a large and varied collection of alcoholic beverages with ethanol content established by a reference technique.
Standards
For the standards, ethanol-water mixtures in the following concentrations were used: 4%, 10%, 20%, 30%, 40%, 50% and 60%. Subsequently, the PLS model was created and verified by the standard technique in which one of the standards is left out of the set, followed by creating a PLS model and then measuring the ethanol concentration for the left out standard. This PLS model was then used to predict the ethanol content of several off the shelf alcoholic beverages.
Experiment
The Durasens LSP-T-9 Diamond ATR FTIR Analyzer (Figure 1), which features a built in multiple reflection diamond ATR, was used to analyze all the samples. The resolution was set to 4 cm-1 and the number of spectra was averaged to 32. Once the PLS model was created, it was imported into the Durasens Analyzer Software that enables straightforward sample spectrum acquisition and analysis.
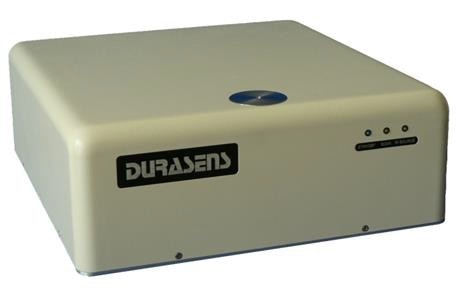
Figure 1. Durasens LSP-T Series Diamond ATR FTIR Analyzer.
Results and Discussion
Figure 2 shows the resulting spectra. The portion of the spectrum in the 2500 cm-1 to 2000 cm -1 region was substituted with a straight line owing to the absorbance of diamond in that region.
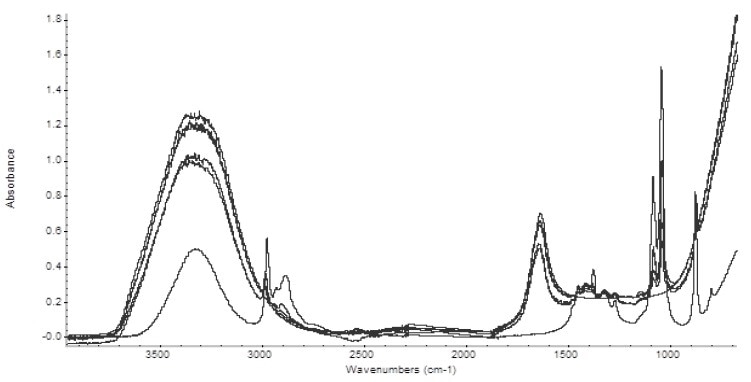
Figure 2. Spectra of the five alcoholic beverages analyzed. Also, shown are spectra of pure water and ethanol.
Table 1 summarizes the results of the above described procedure.
Table 1. Concentrations of alcohol shown on the labels and concentrations predicated using our PLS model
| Sample |
% ethanol on label |
Predicated % ethanol |
| Ethanol |
100% |
100.0% |
| Raki |
43% |
43.1% |
| Retsina |
17% |
14.8% |
| Sake |
15.50% |
19.5% |
| Slivovitz |
50% |
50.10% |
| Tequila |
40% |
42.6% |
| Water |
0% |
0.0% |
Graph 1 displays the results of the analysis as diamonds. Using the same PLS model, the concentrations of standards were calculated and displayed in the graph as squares. Additionally, linear interpolation to the calculated values of standards is displayed to help gauge the linearity of the model as applied to the standards. It is also observed that despite encountering some deviations from the label concentrations, the overall agreement is still good. It is particularly surprising that the model’s prediction for pure ethanol was perfect when rounded to whole percentages. Likewise, the prediction for water was also perfect.
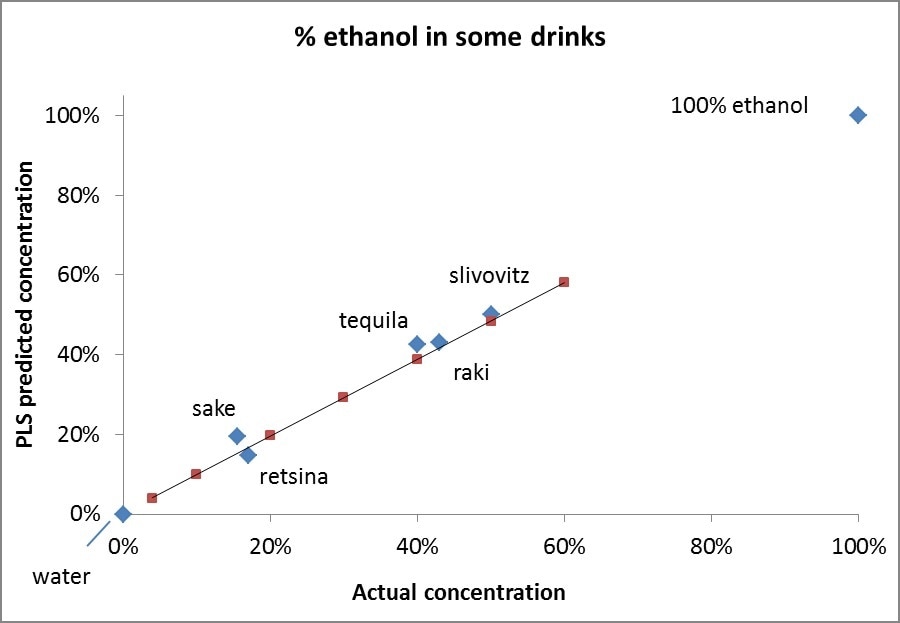
Graph 1. Actual vs. PLS Predicated concentrations of ethanol in a set of five samples of alcoholic beverages. Also shown are Actual vs. PLS Predicated concentrations of ethanol in water and 100% ethanol.
Conclusion
The above results show that multiple reflection ATR is perfect for measuring ethanol content in alcoholic beverages even when a reduced set of ethanol-water standards is used for the development of the PLS model. However, this conclusion is not only limited to ethanol in alcoholic beverages but also extends to any other solute dissolved in water, for example, aqueous solutions of sugars, including sucrose.
This information has been sourced, reviewed and adapted from materials provided by Durasens.
For more information on this source, please visit Durasens.