Globally, some of the most important crops for food, feed, and energy are rice and corn.1,2 Metabolomic profiling is one of the most effective methods for studying the general characteristics of corn and rice, their tolerance to stressful environmental conditions, and their resistance to insects.3
Metabolomics can be used for studying crop diversity and disease resistance. These studies often result in improved yield, quality, and nutritional value.4,5 More particularly, it is possible to assess food quality traits such as taste, fragrance, appearance, nutritional content, and shelf-life by determining their biochemical content.6
In this study, a new benchtop GC-TOFMS was used for metabolomics profiling of rice and corn extracts, and instrument parameters were optimized for speed and detection of a broad range of metabolites after derivatizing the samples through silylation. Powerful software tools were employed to obtain, peak find, and rapidly annotate the rich, high-quality spectral data provided by the new Pegasus BT mass spectrometer from LECO Corporation.
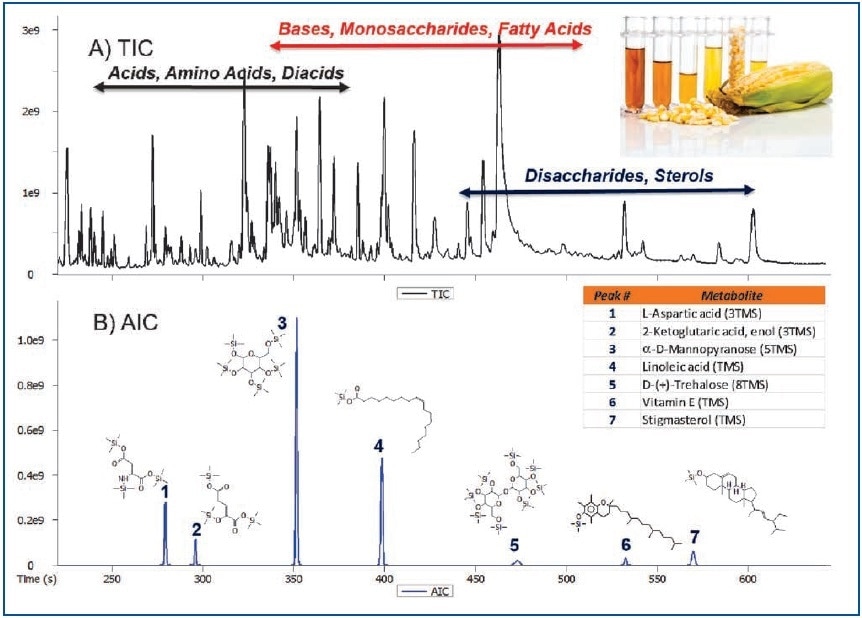
Figure 1. Total Ion Chromatogram (A) and Analytical Ion Chromatogram (B) showing the ability to selectively determine analytes of interest in a complex corn leaf extract.
Experiment
Extraction
A mixture was prepared by adding 400 μL of 4:1 methanol/water to 25 mg of freeze-dried plant material. This heterogeneous mixture was vortexed for 5 minutes, heated for 15 minutes at 70 °C, and centrifuged at 12,000 rpm for 5 minutes. To 400 μL of supernatant, ribitol was added as an internal standard (10 μL; 2000 μg/mL in water). A Speed Vac was used to dry the resulting mixture under vacuum at 60 °C.
Derivatization
To derivatize dry samples, 100 μL of MSTFA was added and heated for 1 hour 60 °C.
Table 1. GC- TOFMS (Pegasus BT) conditions
| Gas Chromatograph |
Agilent 7890 with GERSTEL MPS2 Autosampler |
| Injection |
1 µL, split 20:1 @ 270 °C |
| Carrier Gas |
He @ 0.80 mL/min, Constant Flow |
| Column |
Rxi-5 ms, 20 m x 0.18 mm i.d. x 0.18 µm coating (Restek, Bellefonte, PA, USA) |
| Oven Program |
60 °C (0.5 min), to 320 °C @ 36 °C/min (3 min) |
| Transfer Line |
300 °C |
| Mass Spectrometer |
LECO Pegasus BT |
| Ion Source Temperature |
250 °C |
| Mass Range |
45-600 m/z |
| Acquisition Rate |
20 spectra/s |
Results and Discussion
The Pegasus BT is a benchtop instrument that has the expected characteristics of a modern GC-TOFMS (i.e., robustness, chromatographic resolution, speed, etc.), but with extended linear dynamic range (105) and enhanced sensitivity (parts-per-trillion). This is clearly shown for a set of amino acids in a calibration range between 0.01 and 50 pMol/μL (Table 2). Linearity for calibration curves was excellent as apparent from the correlation coefficients for phenyl alanine aspartic acid, methionine, and lysine which ranged between 0.996 and 0.998 (Figure 2).
An expansion of the lower part of the curves for branched amino acids — Isoleucine and Leucine — shows that linearity is maintained throughout the calibration range (Figure 3; r=0.999).
Table 2. Amino Acid Standard Concentrations are shown in both pMol/μL (0.01 to 50 pMol/μL) and pg on column after a 1 μL injection, split 20:1
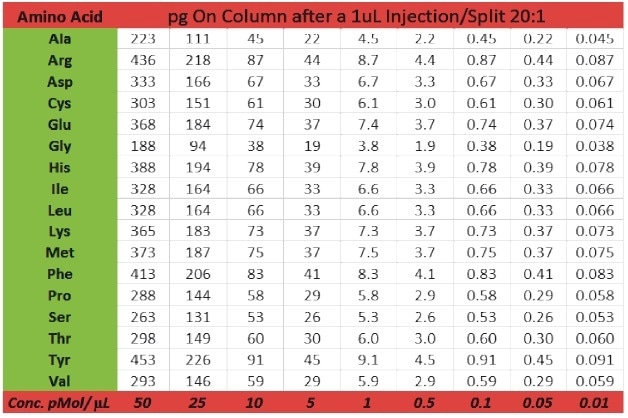
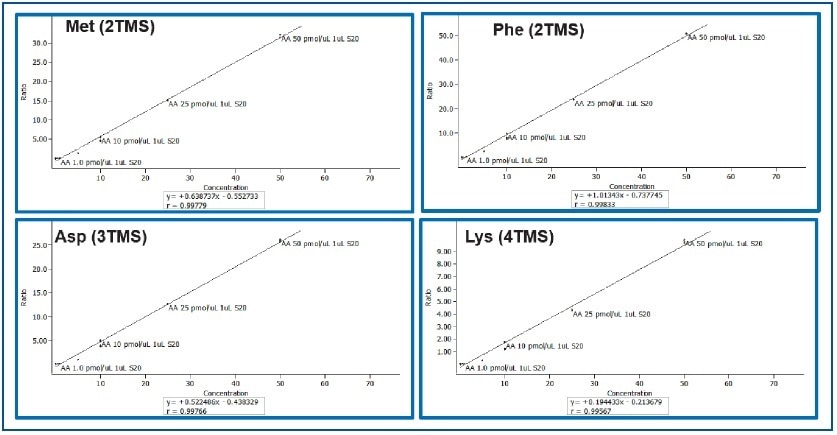
Figure 2. Calibration Curves for Methionine, Phenyl Alanine, Aspartic Acid, and Lysine (0.01 to 50 pMol/μL)
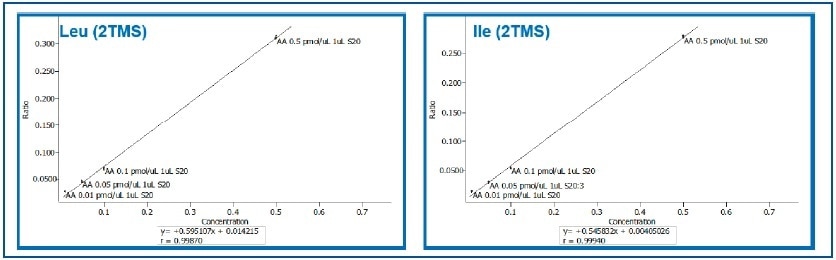
Figure 3. Expansion of Calibration Curves for Leucine and Isoleucine (0.01 to 0.5 pMol/μL).
The integration of LECO's high-performance hardware and next-generation ChromaTOF brand software ® (version 5.0) led to an increased coverage of annotated metabolites in rice and corn samples. Complete metabolomics data was obtained in just over 10 minutes. Metabolites were positively identified through automated, comprehensive data processing which involved peak find, spectral similarity searches against large and well-established databases, and by exploiting retention index values.
Table 3 lists a set of 42 representative metabolites detected and annotated in corn extract. These compounds include acids, diacids, amino acids, terpenes, terpenoids, monosaccharides, disaccharides, and sterols. The metabolites were compared against Wiley and NIST databases and were found to have an average spectral similarity score of 870/1000. The spectral similarity comparisons of Peak True (Deconvoluted) and NIST database mass spectra for (E)-aconitic acid and palmitic acid, which were 916 and 943/1000, respectively clearly shows the quality and richness of data produced by the Pegasus BT instrument (Figure 4).
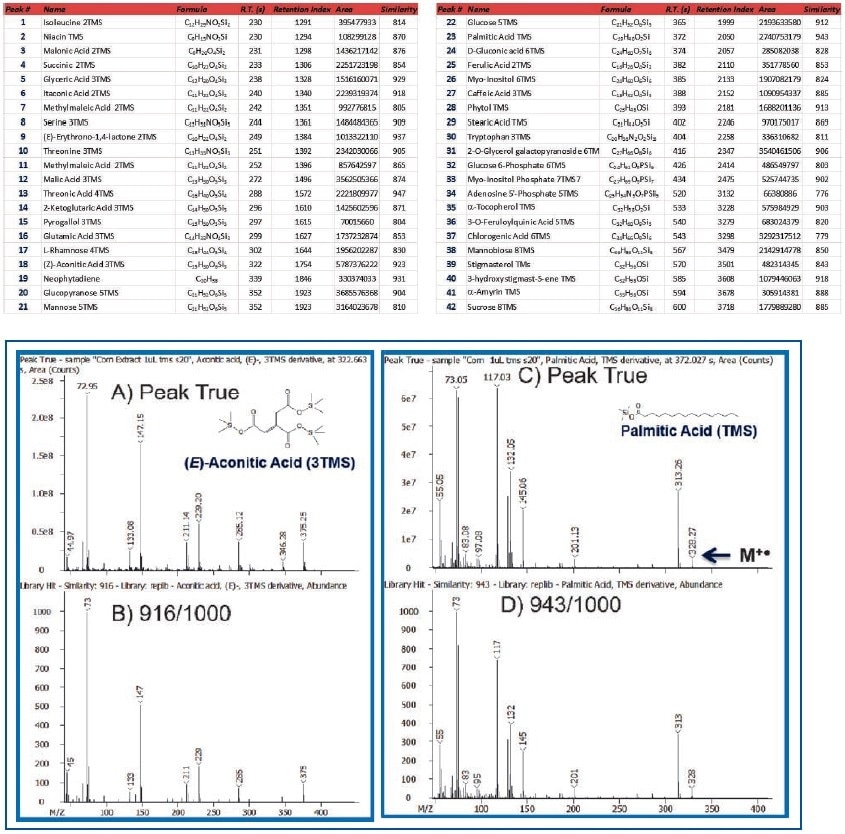
Figure 4. Comparison of Peak True (Deconvoluted-Top) vs. Library Spectra (Bottom) for (E)-Aconitic Acid and Palmitic Acid
An additional level of confidence in metabolite identification was gained by combining database search results with retention index (RI) values, as demonstrated for phytol and serine in Figure 5. The similarity scores for phytol and serine were 945 and 966/1000, and the retention index values were 2179 (Reference value= 2181) and 1361 (Reference value=1369), respectively.
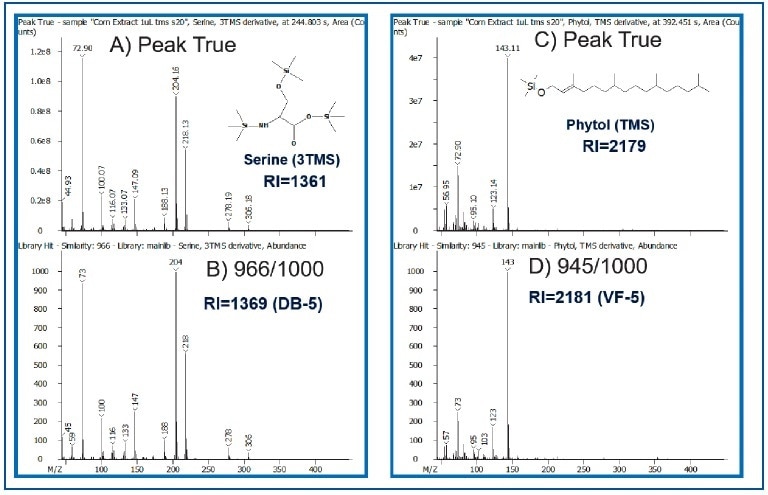
Figure 5. Comparison of Peak True (Deconvoluted-Top) vs. Library Spectra (Bottom) for Serine and Phytol. Calculated RI values are also shown.
The ability to process comprehensive data retrospectively in a targeted manner is a very interesting feature of ChromaTOF 5.0. Target Analyte Finding (TAF) is perfect for quantitative analysis, trace analysis, and processing large datasets.
TAF leverages fragment and/or molecular ions, retention times, and mass tolerances to significantly reduce processing times (Figure 6). A total of 22 metabolites were targeted in the rice and corn data files (Figures 7 and 8). For further analysis, TAF results can be easily exported during processing (for example, statistical).
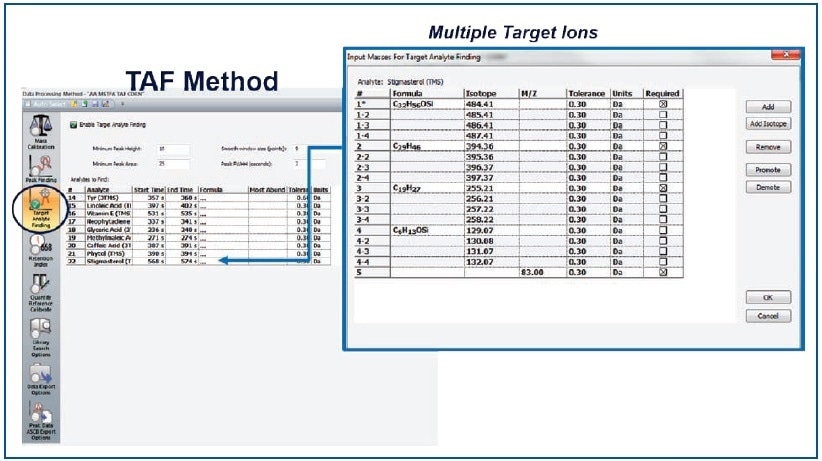
Figure 6. ChromaTOF 5.0 Target Analyte Finding Processing (TAF) Method.
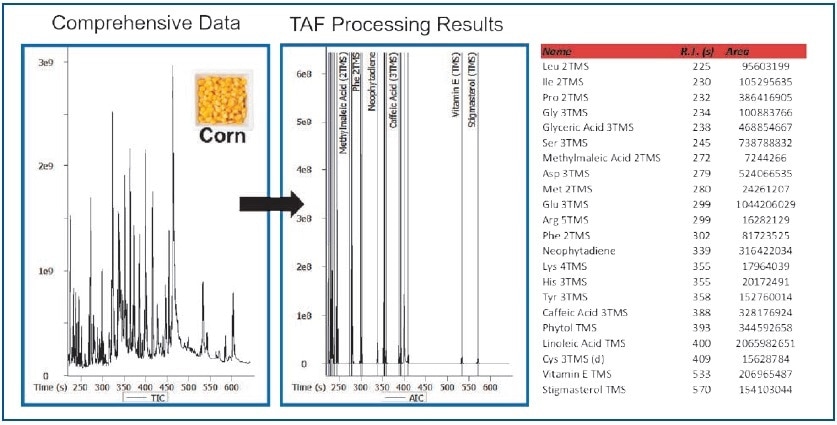
Figure 7. TAF Processing Results – Corn Extract.
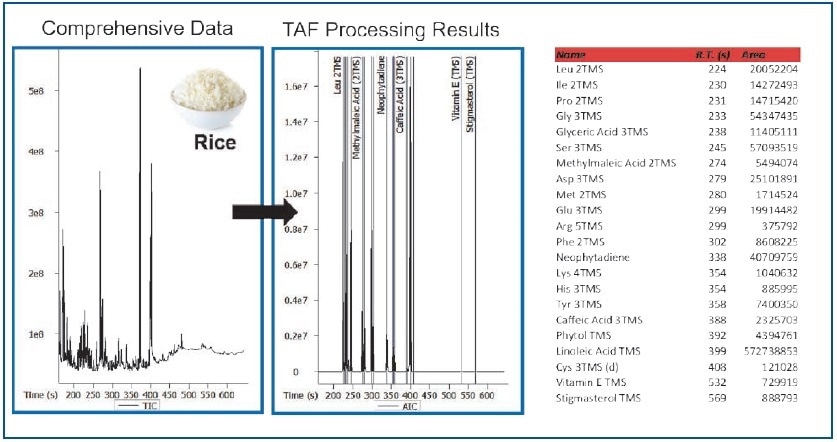
Figure 8. TAF Processing Results – Rice Extract.
Conclusion
LECO's Pegasus BT is a robust and powerful benchtop mass spectrometer that has extended linear dynamic range and excellent sensitivity. The Pegasus BT instrument combined with next-generation ChromaTOF brand software enabled the production of high-quality data that could be processed quickly using Peak Find and/or retrospectively with Target Analyte Finding. The Pegasus BT is a valuable tool for fast, effective, and routine analysis of complex biological samples.
References and Further Reading
- M. Chen, R.S.P. Rao, Y. Zhang, C. Zhong and J.J. Thelen, The Crop Journal, 2016, 4, 177-187.
- M. Kusano, Z. Yang, Y. Okazaki, R. Nakabayashi, A. Fukushima and K. Saito, Molecular Plant, 2015, 8, 58-67.
- Y. Okazaki and K. Saito, Plant Biotechnol. Rep., 2012, 6, 1-15.
- C. Simo, C. Ibanez, A. Valdes, A. Cifuentes and V. Garcia-Canas, Int. J. Mol. Sci., 2014, 15, 18941-18966.
- G. Astarita nad J. Langridge, Journal of Nutrigenetics and Nutrigenomics, 2013, 6, 181-200.
- J.W. Allwood, A. Erban, S. De Koning, W.B. Dunn, A. Luedemann, A. Lommen, L. Kay, R. Loscher, J. Kopka, and R. Goodacre, Metabolomics, 2009, 5, 479-496.

This information has been sourced, reviewed and adapted from materials provided by LECO Corporation.
For more information on this source, please visit LECO Corporation.