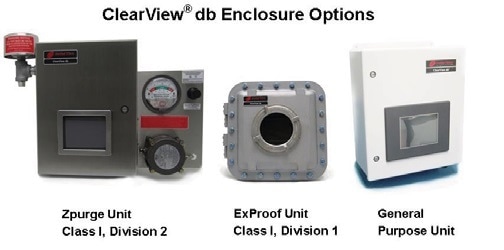
The product line of Process Insights includes a near-infrared (NIR) dual beam spectrometer, the NIR-O™, and a multi-wavelength photometer, the ClearView® db, that are highly suitable for measuring many hydrocarbon gas streams.
The instrumentation of Process Insights’ NIR is capable of making both qualitative and quantitative measurements in gas streams by utilizing long path gas cells combined with the Process Insights analyzer systems using fiber optics.
In the following article, the use of Process Insights hardware and software tools to measure hydrocarbon gases under various conditions will be discussed. In comparison to traditional methods, NIR measurements are capable of being used in real time in process monitoring in the interest of saving both time and money.
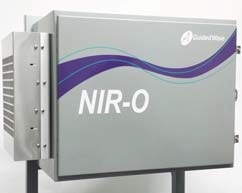
NIR Online Process Analyzers NIR-O (spectrometer) ClearView db (photometers)
Background
The NIR section of the electromagnetic spectrum accepts the use of the overtone and combination bands of the C-H, O-H, and N-H fundamentals. Via measuring the NIR spectra of a sequence of gas samples of established concentration, a quantitative model can be created which will permit the measurement of upcoming samples solely based on their NIR spectrum.
The analyzer systems of Process Insights utilize fiber optics to facilitate the sample probe to be positioned in dangerous, remote locations away from the spectrophotometer itself.
The majority of NIR spectrometry is performed on liquid samples where the hindered rotation blurs any rotational fine structure, causing broad peaks. Gases, on the other hand, have well resolved rotational-vibrational (ro-vibrational) fine structure which is visible in high resolution.
The majority of NIR process spectrometers and photometers are low resolution machines, and thus do not resolve the fine spectrum, but alternatively document the spectrum as integrated P, Q, and R bands. When working with gases, it’s important to remember that the actual spectrum underneath is a complicated series of narrow sharp peaks.
Longer probe lengths are needed for gases because the molecular density of gases and vapors is considerably lower than that of liquids. High standard NIR spectra of gases can be acquired with probe pathlengths within 25 to 100 cm.
In addition to lower densities, the density fluctuates with temperature and pressure according to the Ideal Gas Law. The spectrometer measures the number of molecules in the beam, however it might be essential to measure temperature and pressure on top of that to exactly quantify the gas mixture.
An additionally imperative aspect of gas phase spectroscopy is that the spectra depend on pressure and temperature. Due to the pressure broadening, the to-vibrational lines will broaden in response to increasing pressure. For first order effects, the integrated absorption seen with a low resolution spectrometer should stay the same as pressure increases, but there might be second order effects that need to be taken into account and added to the modeling efforts.
A large problem can be posed by temperature. Several multi-atom molecules will have low lying bending mode bands whose Boltzmann thermal population will grow as the temperature rises. These combination “hot” bands will emerge in the spectra robbing intensity (population) from the fundamental ground state transition bands. The best thing to do is to calibrate a gas phase measurement at one temperature and uphold that temperature for the process measurement.
Finally, because an alternation in the dipole moment is needed for a ro-vibrational IR spectrum to happen, not all molecules display an IR or NIR spectrum. Homonuclear molecules, such as N2, O2, Cl2, and H2, lack dipole moments and therefore do not have IR spectra. Luckily, the majority of hydrocarbons, and several other significant gases such as NH3, CO2, H2O, etc. possess strong IR spectra and thus NIR spectra. Unfortunately, several common sulfur compounds possess weak IR spectra and congruently weaker NIR spectra.
Experimental
Using a Process Insights Model NIR-O process spectrometer, the vapor phase NIR spectra of a collection of different hydrocarbons were measured between 1,550 and 1,900 nm. The absorbance spectra of a number of short chain alkanes collected utilizing an on-line process probe with a 25 cm pathlength is shown in Figure 1.
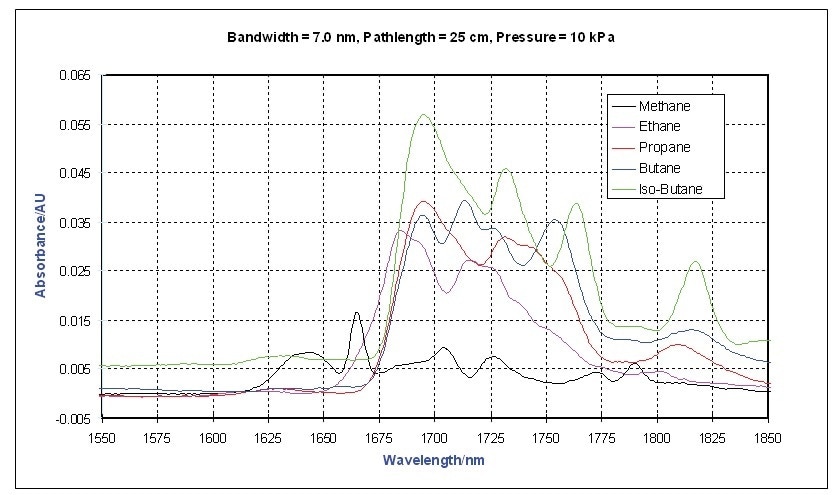
Figure 1. Vapor Phase NIR Spectra - Short Chain Alkanes
Methane has the most distinctive spectrum, however this is expected because it is the simplest and has the smallest moment of inertia. This study focuses on the first overtone region of the C-H stretching bands near 1700 nm. The differences between ethylene and propylene are shown in Figure 2. Usually, olefins have a strong band at 1,625 nm.
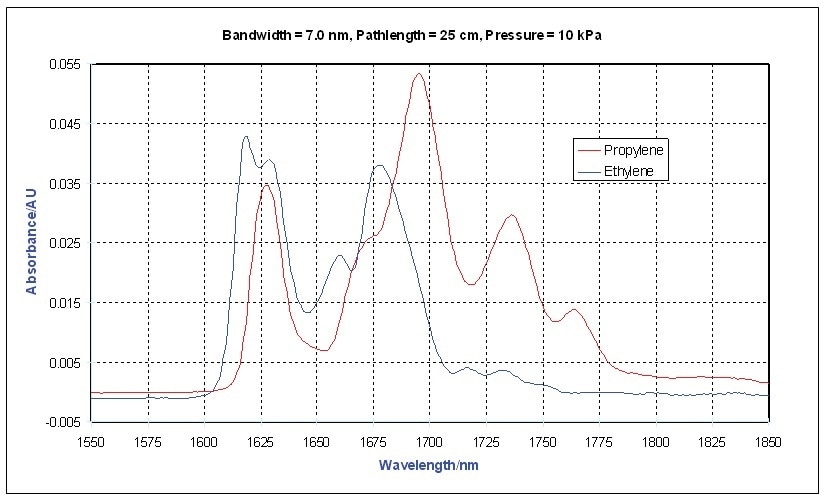
Figure 2. Vapor Phase NIR Spectra - Ethylene, Propylene
This is also illustrated in Figure 3 in the vapor phase spectra of a number of other olefins.
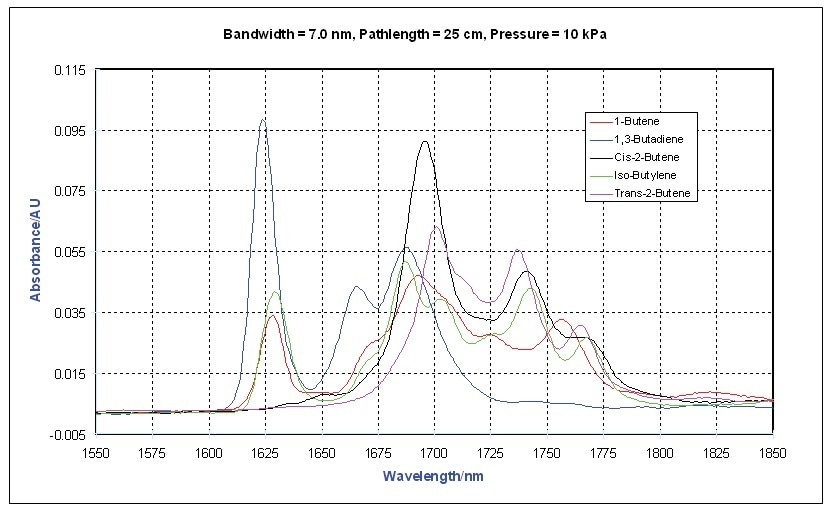
Figure 3. Vapor Phase NIR Spectra - Olefi ns
The concentration relative to the Lower Explosion Limit (LEL) is a widespread concern of hydrocarbon vapors, particularly in ambient air mixtures. Table 1 demonstrates the detection limits for a number of light hydrocarbons under these conditions: Instrumental Signal-to-Noise Ratio of 40 µAU, a smallest concentration equal to 10 times the SNR or 400 µAU, a pathlength of 1 m, and a neat sample condition at 20 °C. Notice that the detection limits all are considerably below the respective LEL.
Table 1. Vapor Detection Limits
| |
Wavelength |
Absorption |
Detection |
Detection |
|
| of Max Abs. |
Coefficient |
Limit |
Limit |
LEL |
| nm |
AU/kPa/cm |
kPa |
ppm-V |
ppm-V |
| Methane |
1665 |
0.000064 |
0.063 |
618 |
50000 |
| Ethane |
1680 |
0.000129 |
0.031 |
307 |
30000 |
| Propane |
1690 |
0.000159 |
0.025 |
248 |
21000 |
| Butane |
1714 |
0.000154 |
0.026 |
257 |
18000 |
| Ethylene |
1619 |
0.000171 |
0.023 |
231 |
31000 |
| Propylene |
1695 |
0.000208 |
0.019 |
190 |
20000 |
| 1-Butene |
1693 |
0.000180 |
0.022 |
220 |
16000 |
| 1,3-Butadiene |
1625 |
0.000376 |
0.011 |
105 |
20000 |
| Cis-2-Butene |
1696 |
0.000353 |
0.011 |
112 |
18000 |
| Iso-Butane |
1695 |
0.000192 |
0.021 |
206 |
14000 |
| Iso-Butylene |
1687 |
0.000197 |
0.020 |
200 |
16000 |
| Trans-2-Butene |
1701 |
0.000241 |
0.017 |
164 |
18000 |
An additional series of tests were performed with butane in nitrogen to study the self and foreign gas broadening issues. Changes in absorption coefficients are also influenced by collisional energy transfer. Neat butane to 1 atm was recorded in addition to various fixed levels buffered with N2 to 1 atm. Figure 4 shows the concentration matrix that was studied.
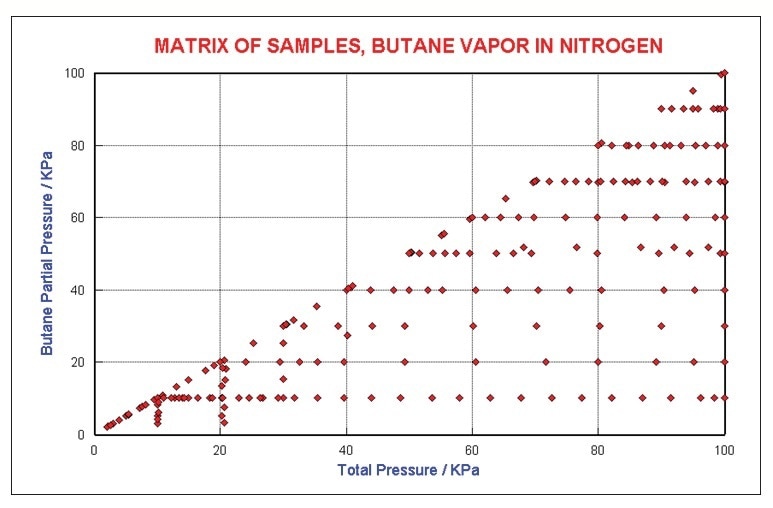
Figure 4. Butane Concentration Matrix
Analysis
Basic data analysis was used to make a model for butane in N2. Predictions of concentrations of neat butane up to 100 kPa is uncomplicated. Figure 5 illustrates the regression results made by a four wave-length model. Quantification is to around ±0.46 kPa.
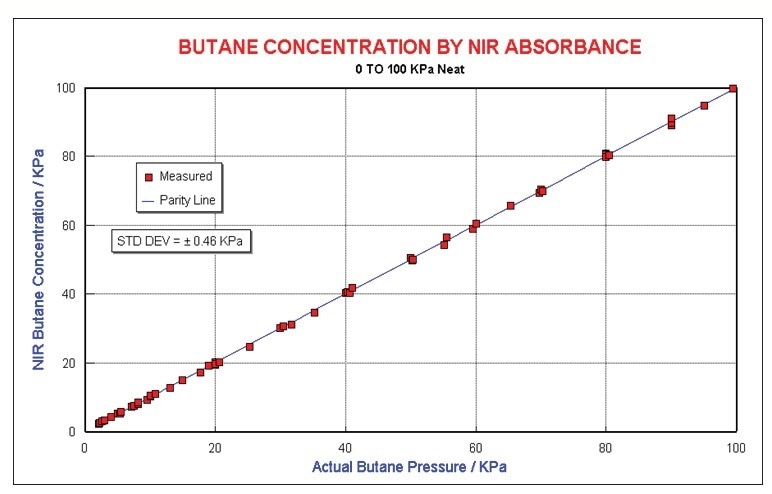
Figure 5. Butane results
Examining butane concentration at constant total pressure in an N2 matrix shows a sensibly linear relationship to absorbance for dilute mixtures for butane. As shown in Figure 6, mixtures that are over 80% butane diverge considerably as the broadening and energy transfer mechanisms shift from foreign gas to self-broadening.
A quadratic equation was used to model this non-linearity. Figure 6 illustrates the regression results generated by regressing all of the non-neat butane data using a two wavelength model in addition to linear and quadratic terms in total pressure. Concentrations were estimated to ±3 kPa.
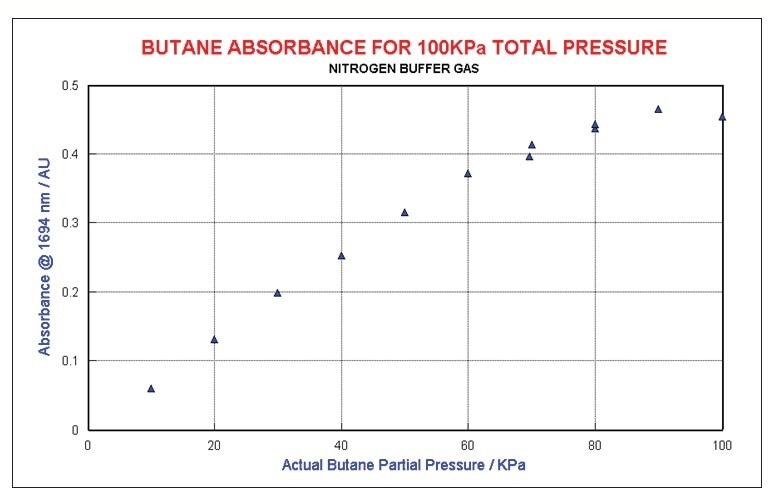
Figure 6. Butane at constant total pressure
Discussion
The presented data shows that neat vapors and gases are capable of being measured by NIR spectroscopy to better than 500 ppm-m. In addition, the data demonstrates that that foreign gas collisional energy transfer considerably changes the absorption coefficients. The changes to the spectral shape induced by foreign gas are small but measurable (and capable of being modeled).
Conclusion
Here it has been shown that simple hydrocarbon gases and vapors have one of a kind NIR spectra that is capable of easily being measured with outstanding sensitivity. For simple systems, quantitative mixture analysis can be achieved by picking a few strategic wavelengths and carrying out a simple linear regression. The ClearView db is a cost-effective solution for simple systems utilizing discrete wavelengths.
Linear methods can still be used for more complex mixtures that involve pressure broadening, however, more calibration data will be necessary. While not shown here, mixture analysis is capable of being carried out through utilization of the neat spectra of the individual gases as a basis set to deconvolve the unknown spectrum, thereby extracting the individual concentrations. For these complex systems, a NIR-O spectrometer would be better suited.
The vapor phase measurements discussed in this piece are both fast and reliable, using Process Insights analyzer hardware and software tools. Outcomes are accessible in real-time (seconds) for complex streams.
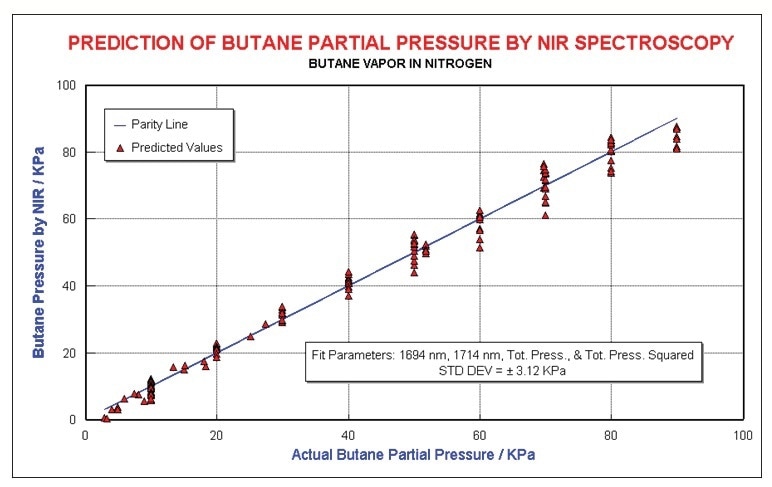
Figure 7. Butane results, modeling pressure non-linearity
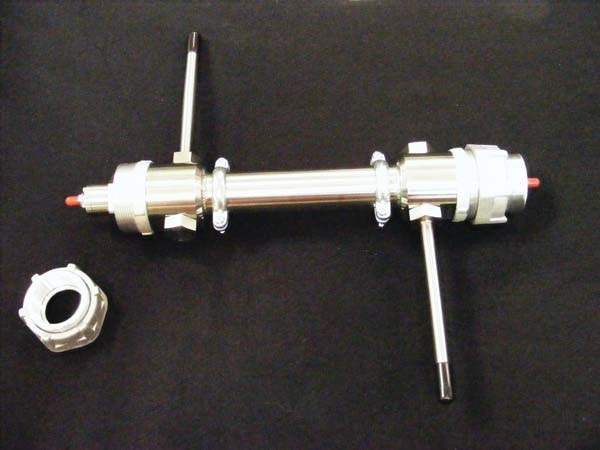
Figure 8. 25 cm Gas Flow Cell

This information has been sourced, reviewed and adapted from materials provided by Process Insights – Optical Absorption Spectroscopy.
For more information on this source, please visit Process Insights – Optical Absorption Spectroscopy.