A polyolefin’s performance is reliant on the levels of additives that are compounded into the polymer. Therefore, it is beneficial to regulate the amount of additive in the end product melt. The existing offline techniques of control for these additives include high-performance liquid chromatography (HPLC) and gas chromatography (GC). Besides being off-line analyses, these techniques are mostly labor-intensive and time-consuming. It is not unusual to have more than a few hours delay between the collection of a sample and the reporting of analytical results. In that time, numerous pounds of out of specification polymer may have been manufactured.
Online, or inline, UV spectrophotometric analysis is an effective method for providing real-time (<30 seconds) measurement of the antioxidant additives in the polymer melt. Real-time analysis enables more rigorous control of the additive concentrations to match the target specifications of the end product. In turn, the end product will more often match the specifications and less scrap material will be created.
There are numerous polymer additives, and additive packages (mixtures of individual additives in predetermined ratios) being utilized by polymer manufacturers. The purpose of any specific additive is reliant on its chemical structure. The additives may enhance the properties of the target polymer in its end use form. An additive may also help in the processability of the polymer. This article focuses on the measurement of both primary and secondary antioxidants in a polyolefin melt using online UV fiber optic spectroscopy.
The reason for adding antioxidants into a polymer melt is to decrease oxidation from light, heat, or stress. Almost all polyolefins require some type of an antioxidant additive to stop degradation. Degradation happens upon the initiation of free radicals. These free radicals are created in the polymer by light, heat, or stress and comprise of an unpaired electron which makes them extremely reactive. The free radical forms a peroxy radical by reacting with an oxygen molecule. This new radical will then react with an available hydrogen atom. If this hydrogen atom is on the polymer, an unstable hydroperoxide is produced together with another free radical. This regeneration of the free radical species, and the oxidation reaction, will continue unconstrained in the absence of an antioxidant. Ultimately, the polymer degrades from chain scissoring or crosslinking.
The role of the antioxidant is to stop the propagation of oxidation in the polymer melt. The most common main antioxidants are hindered phenols. These antioxidant compounds serve as scavengers of free radicals by “donating” their reactive hydrogens to the free radical. This halts the development of subsequent free radicals and the oxidation reaction is stopped. Secondary antioxidants, usually organophosphites, target the unstable hydroperoxide and reduce it to an alcohol.
The antioxidants being researched exhibit characteristic absorption of UV light (200 nm-400 nm) because of their chemical composition. By correlating the quantity of an additive with its matchless absorption band, on-line analysis using UV fiber optic spectroscopy is successful in effectively monitoring the levels of polyolefin antioxidant additive.
Theory
Measuring the concentration of an antioxidant additive in a polymer melt is usually realized off-line in an analytical laboratory. The most typical analysis techniques are HPLC and GC. The collection of samples, preparation, and analysis is usually labor-intensive and time-consuming. However, the monitoring of a polyolefin melt on-line offers real-time results (<30 seconds) for additive control. This can be achieved using UV spectroscopy (Figure 1).
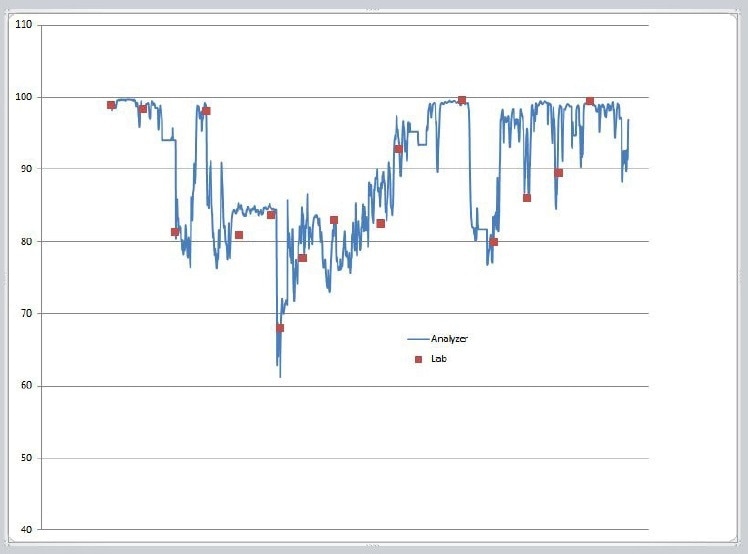
Figure 1. Example Process change; Online vs. Lab Method
Ultraviolet (UV) spectroscopy is based upon the measurement of the amount of light absorbed, (or conveyed), via a sample when exposed to a specified amount of light. The UV region has the wavelengths from about 200 nm to 400 nm. Through Beer’s Law, the amount of light absorbed by a sample can be correlated to the additive concentration in that sample. The antioxidants in this research display overlapping, but distinctive absorption bands in the UV region. Specifically, phenolic and carbonyl functional groups display robust UV absorption.
A standard online analyzer system includes single strand fiber optic cables, a computer-controlled UV spectrometer, probe(s), and communication hardware to connect with the control computer (DCS). For challenging environments, the analyzer can be packaged in a NEMA 4 enclosure. However, with single strand fiber optics, this is generally not necessary.
A fiber optic cable conveys light from the spectrometer to a probe which interfaces with the sample. The sample will absorb some of this incident radiation according to the molecular structure. The remaining light is received at a second fiber optic probe and cable and conveyed back to the analyzer. The silica-based optical fiber is packed using an environmentally sound process. The probes are usually fabricated from stainless steel and comprise of sapphire windows and lenses to collimate the light beam. These probes are produced to endure the extreme pressures and temperatures found in the process setting. The analyzer software is programmed for advanced data treatment, calibration development, instrumental control and functional diagnostics, spectral analysis, and process monitoring tasks (bar graphs, trend charts, logging, etc.).
Experiment
The samples for this research were all analyzed on a Wayne 1.25 inch single screw extruder. The polyolefin resins were extruded at approximately 450 °F, a screw speed of 35 rpm, and a pressure of 600-650 psi.
A Process Insights UV/Visible spectroscopic analyzer was interfaced to the extruder via two fiber optic cables and a set of light collimating transmission probes. The sample measurement location was at the extruder die where the polymer is molten and before any pelletizers or coolers, as shown in Figure 2.
Spectral measurements, relative to a background reference scan, were captured in absorbance units (AU) from 250 nm to 450 nm. Four scans for every sample were averaged to create a single UV spectrum. Data correlation and modeling of the data sets was done in the UNSCRAMBLER multivariate calibration software. The resulting UNSCRAMBLER model file can be adapted for online use in the analyzer software.
Initial laboratory work showed that online measurement might be possible. Samples of Himont Profax 6501 resin containing recognized amounts of antioxidant additives were extruded. One sample set contained a primary antioxidant (referred to as AOX1) and a secondary antioxidant (AOX2) in variable ratios. The aim was to establish the primary as well as secondary antioxidant concentrations. The second sample set contained a slip agent (SL1) and a phenolic antioxidant (AOX3). The purpose of the second set is to establish if the slip agent might obstruct the measurement of the antioxidant.
Advantages of Fiber Optic UV Spectroscopy
Some of the advantages of fiber optic UV spectroscopy can be summed up as follows:
- Fibers are intrinsically safe and may be used in challenging environments
- Advanced sampling systems, or side loop, may no longer be needed. A fiber optic probe can be inserted directly into the process to offer the essential measurements.
- With online analysis, sample preparation is not necessary. This reduces the need for labor-intensive laboratory techniques. An extra advantage is that lab personnel are exposed less often to possibly dangerous chemicals.
- More information is returned with minimal delay. A lab analysis may take several hours to finish. In contrast, online analysis offers a new analysis every 30 seconds.
- The measurement is performed on the sample while it is in the process. It is a correct reading of what is taking place in the process at that specific time.
Results
Spectral scans of the first data set comprising of the two antioxidants were gathered for each of the variable concentrations. The spectra were baseline modified to eliminate any baseline variations. These small offsets across the whole spectrum are mainly because of changes in the refractive index of the individual samples, or sometimes to some minor instrument drift. In either case, a baseline correction makes up for the small offset.
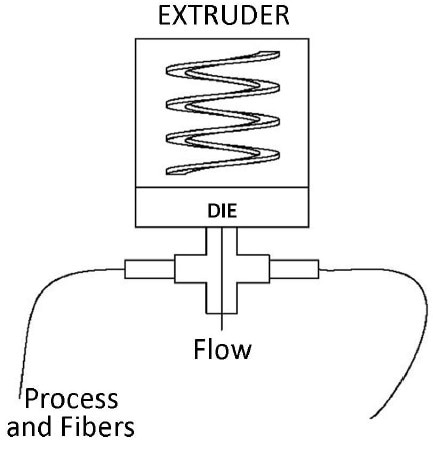
Figure 2. Extruder
The spectral scans were then correlated to the identified concentration values for each of the samples. This was accomplished using a partial least squares (PLS) algorithm in the UNSCRAMBLER multivariate calibration program. A cross-validation, or “leave one out”, technique was utilized for corroboration. For instance, a sample scan is taken off from the calibration set and a model is produced utilizing the remaining samples. This model then predicts the value of the initially removed sample as if it were an “unknown.” This is completed for each sample in the data set and provides a measure of the predictive ability of a model. It is imperative to note that as a “secondary” technique UV spectroscopy depends upon the values (concentrations) delivered by a primary technique. The secondary technique’s accuracy will only be as good as the accuracy of the primary technique. In this research, the samples were prepared gravimetrically and this becomes the “primary method.” The primary method may also be a laboratory analysis (HPLC or GC for instance). However, the precision of on-line spectroscopy is mostly superior to the primary method.
The first calibration set of AOX1 and AOX2 had 16 samples with variable levels of antioxidant ranging from 250 ppm to 1500 ppm. The prediction results are illustrated in Tables 1 and 2. Correlation plots for each of the antioxidants are illustrated in Figures 3 and 4. The normal error of prediction (SEP) for AOXl is established to be 18. The SEP for AOX2 is somewhat higher at 30. While the results are favorable,, they lead to observations. These samples were readied gravimetrically. Thus, the antioxidant concentrations were established before the samples were added to the extruder. The “known” values were not established individually after extrusion. Sample stratification, poor mixing, and other factors could have resulted in wrong assumptions about the true concentration. Furthermore, the antioxidants may have reacted (as they are meant to) or degraded. A more accurate main measure of melt composition would be to have the final melt compounded product examined in the laboratory to confirm the concentrations of antioxidant in the polyolefin.
Table 1. AOX1
| Sample |
AOX1 (ppm) |
Predicted AOX1 (ppm) |
| 1 |
500 |
533 |
| 2 |
1000 |
971 |
| 3 |
250 |
233 |
| 4 |
750 |
740 |
| 5 |
1250 |
1265 |
| 6 |
500 |
502 |
| 7 |
1000 |
1011 |
| 8 |
1250 |
1263 |
| 9 |
250 |
235 |
| 10 |
750 |
758 |
| 11 |
1500 |
1508 |
| 12 |
750 |
757 |
| 13 |
1000 |
966 |
| 14 |
500 |
528 |
| 15 |
1000 |
995 |
| 16 |
1500 |
1484 |
Table 2. AOX2
| Sample |
AOX2 (ppm) |
Predicted AOX2 (ppm) |
| 1 |
250 |
301 |
| 2 |
250 |
273 |
| 3 |
500 |
489 |
| 4 |
500 |
497 |
| 5 |
500 |
525 |
| 6 |
750 |
706 |
| 7 |
750 |
740 |
| 8 |
750 |
768 |
| 9 |
1000 |
959 |
| 10 |
1000 |
974 |
| 11 |
1000 |
1010 |
| 12 |
1250 |
1215 |
| 13 |
1250 |
1221 |
| 14 |
1500 |
1534 |
| 15 |
1500 |
1456 |
| 16 |
1500 |
1484 |
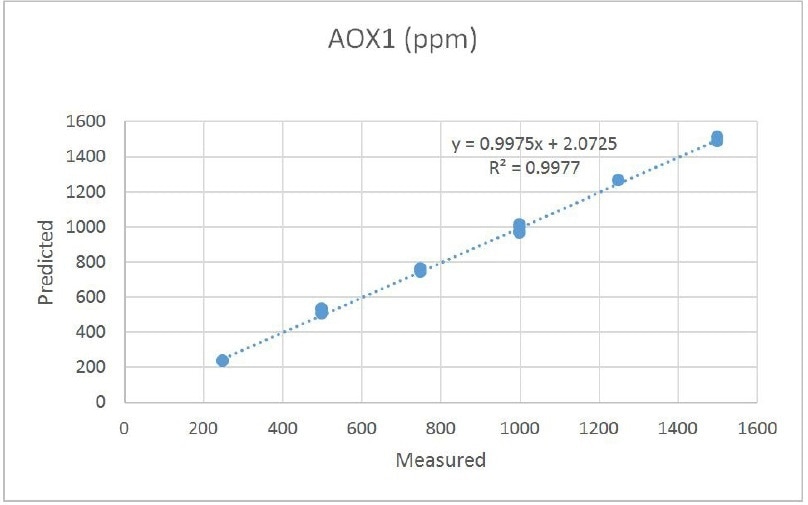
Figure 3. Antioxidants - AOX1 Octadecyl3,5-bis (1,1-dimethylethyl)-4-hydroxybenzene propanoate
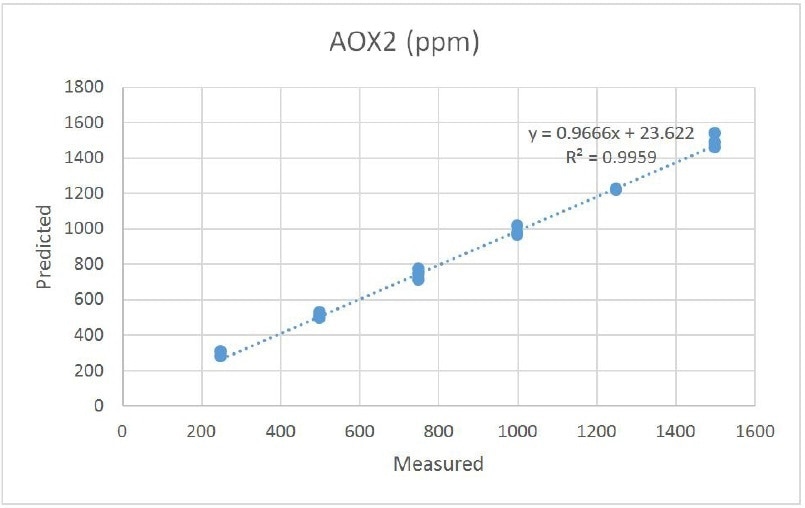
Figure 4. Antioxidants - AOX2 2,4-Bis(1,1-dimethylethyl)phenyl-phosphite (3:1)
The second set of calibration samples has 25 samples of different levels of AOX3 and SLl. The reason for performing this calibration set is to establish the viability of measuring the antioxidant in the presence of a slip agent. The prediction results for AOX3 for each of these samples is illustrated in Table 3 and the correlation plot is shown in Figure 5. The SEP for AOX3 is established to be 17. This is quite like the SEP for the phenolic antioxidant in the first calibration set. There is no connection (as anticipated) for the slip agent, SLl. It is also obvious that the slip agent did not inhibit the measurement of AOX3.
Table 3. AOX3
| Sample |
AOX3 (ppm) |
Predicted AOX3 (ppm) |
SLJ (opm) |
| 1 |
1500 |
1503 |
1500 |
| 2 |
1500 |
1487 |
1500 |
| 3 |
1500 |
1490 |
1500 |
| 4 |
1500 |
1481 |
1500 |
| 5 |
1500 |
1478 |
1500 |
| 6 |
300 |
310 |
1500 |
| 7 |
300 |
302 |
1500 |
| 8 |
300 |
313 |
1500 |
| 9 |
300 |
302 |
1500 |
| 10 |
300 |
308 |
1500 |
| 11 |
1000 |
983 |
1000 |
| 12 |
1000 |
978 |
1000 |
| 13 |
1000 |
972 |
1000 |
| 14 |
1000 |
974 |
1000 |
| 15 |
1000 |
981 |
1000 |
| 16 |
1500 |
1524 |
500 |
| 17 |
1500 |
1524 |
500 |
| 18 |
1500 |
1524 |
500 |
| 19 |
1500 |
1522 |
500 |
| 20 |
1500 |
1524 |
500 |
| 21 |
300 |
313 |
500 |
| 22 |
300 |
307 |
500 |
| 23 |
300 |
299 |
500 |
| 24 |
300 |
301 |
500 |
![Antioxidants - AOX3 Tetrakis[methylene(3,5-di-tert-butyl-4-hydroxyhydrocinnamate)]methane](https://d12oja0ew7x0i8.cloudfront.net/images/Article_Images/ImageForArticle_16668_44963195835393528232.jpg)
Figure 5. Antioxidants - AOX3 Tetrakis[methylene(3,5-di-tert-butyl-4-hydroxyhydrocinnamate)]methane
Conclusions
The results show that fiber optic UV spectroscopy can be effectively executed online for monitoring of antioxidants in a melt. Real-time online analysis of the polymer melt can offer endless updates (<every 30 seconds) on the melt composition. This method has been verified as effective for single as well as for multiple component systems. Furthermore, the presence of a slip agent does not seem to have an impact on the determination of antioxidant concentration. Online analysis can offer a rapid, accurate, and effective means of monitoring, and regulating, antioxidant additives in polyolefins to help keep a check on product quality.
Appendix
AOX1: Octadecyl3,5-bis (1,1-dimethylethyl)-4-hydroxybenzene propanoate
AOX2 2,4-Bis(1,1-dimethylethyl)phenyl-phosphite (3:1)
AOX3 Tetrakis[methylene(3,5-di-tert-butyl-4-hydroxyhydrocinnamate)] methane
SL1 Erucamide

This information has been sourced, reviewed and adapted from materials provided by Process Insights – Optical Absorption Spectroscopy.
For more information on this source, please visit Process Insights – Optical Absorption Spectroscopy.