If the conditions are right, it is possible to measure low concentrations of organic solutes in water solutions using near-infrared (NIR) analysis with the NIR-OTM Process Analyzer Spectrometer. This article explores this application with the detection of saccharin at concentrations below 60 ppm between temperatures of 16 – 32 °C.
Process Insights’ product line features a UV-Vis spectrophotometer, Model 508. This article discusses the use of Process Insights hardware and software tools for the measurement of various triazines using fiber optic-based, UV-Vis spectroscopy.
UV-Vis spectroscopy can be used in real time directly in process monitoring, it can also be used in a laboratory procedure. In either case UV-Vis spectroscopy is a money and time saving alternative to traditional chemical methods.
Saccharin in Water
The spectrum of water with 1% dissolved sodium saccharin hydrate, analyzed at a 2 mm path, is shown in Figure 1. The first aromatic (C-H) absorption can be clearly seen at 1,661 nm in the difference spectrum, but is hidden by waters baseline absorbance of 0.5 AU in the regular spectrum.
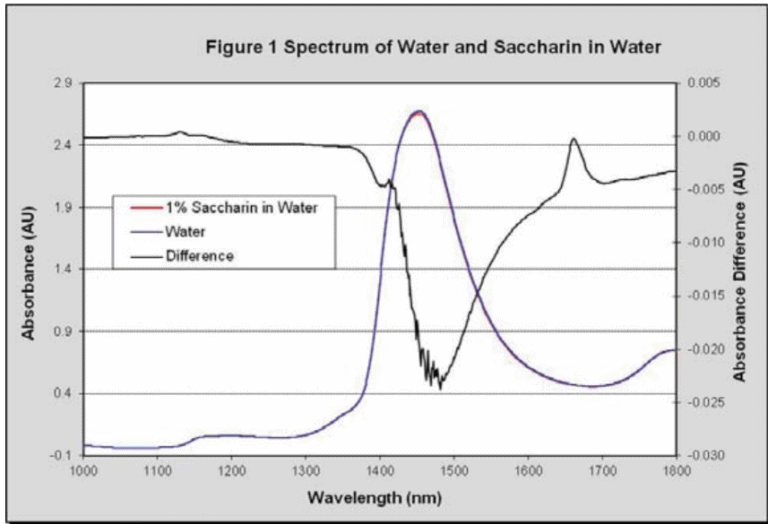
This baseline absorbance is 100 times greater than saccharin’s absorption when it is present at 1% concentration. If saccharin is present at 100 ppm concentration then water’s baseline is 10,000 times greater than saccharin’s absorption, making accurate concentration determination challenging.
Water in the NIR
Water is a frequently used solvent however it is challenging to analyze using NIR as it absorbs as strongly in this region, in addition the high polarity of water means it has a large spectral thermal coefficient as demonstrated in Figure 2. In particular in the region around 1660 nm (which is important for saccharin) the impact that temperature has on water’s spectrum is significant.
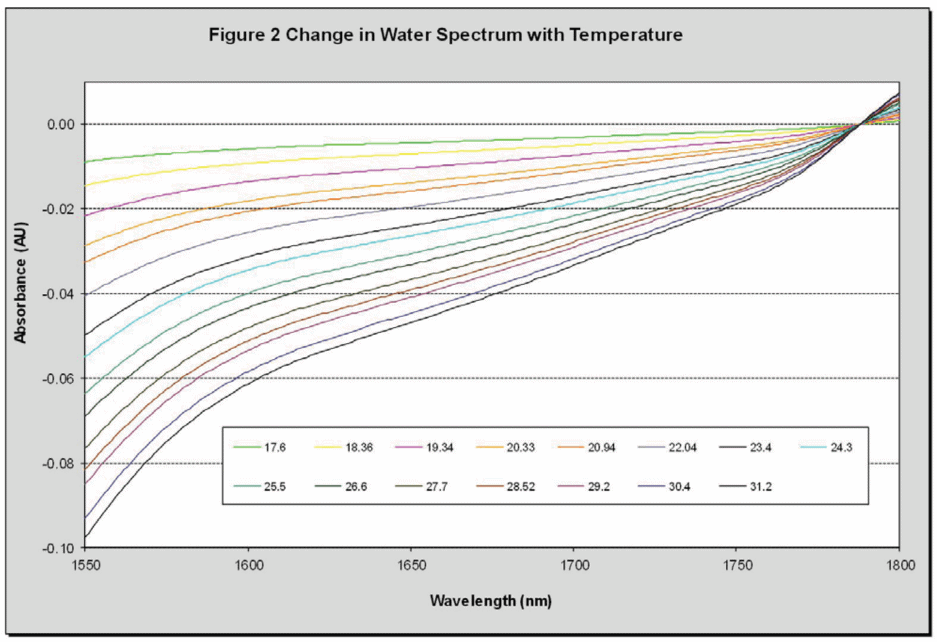
For this reason, the temperature must either be controlled extremely accurately during measurements or temperature effects must be removed mathematically. It is fortunate that changes in water’s NIR spectrum due to temperature are extremely regular, allowing them to be accurately modeled and removed from spectra.
The Data Set
The NIR spectra of samples of DI (deionized) water and dissolved sodium saccharin hydrate in DI water were taken using a Process Insights 2 mm SST probe, connected to an extended range Process Insights NIR-OTM spectrometer by single-strand low-OH fused silica fiber optics (40 m length, 500 μm diameter), with temperature measurement using a RTD temperature sensor.
16 spectra were collected of DI water and a total of 368 spectra of saccharin dissolved in DI water at concentrations between 0.0016 wt% - 1.014 wt%, with a total of 13 different solutions, and temperatures between 16 – 32 °C. All solutions were prepared from solid sodium saccharin hydrate by weight. Each spectrum was the average of 32 scans collected over 93 seconds each. The noise measured during this process (between 1550 nm to 1800 nm) was recorded as 13 μAU rms.
Removing the Water
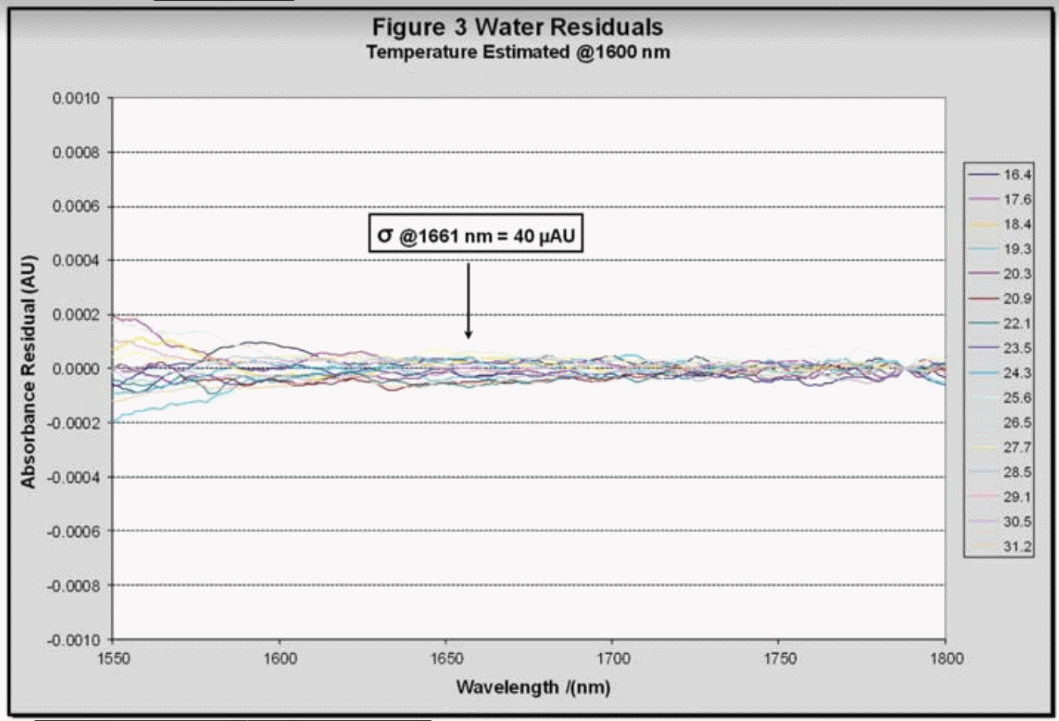
After analysis of the recorded data it was concluded that the ±0.1 °C accuracy of the RTD was not enough for this application and that sufficient temperature control is not possible. Using the data collected from the DI water sample a quadratic regression model was built at RTD temperature and 1600 nm. The model’s residuals were random and the spectra repeatable, demonstrating that this method is more accurate than using the RTD.
Using the temperatures predicted by the model the wavelength-dependent absorptions were further regressed using a quadratic model with the spectra residues for water shown in Figure 3. These residues are extremely close to the analyzer’s noise floor, demonstrating that this method of removing the water signal is effective.
The Saccharin Solution
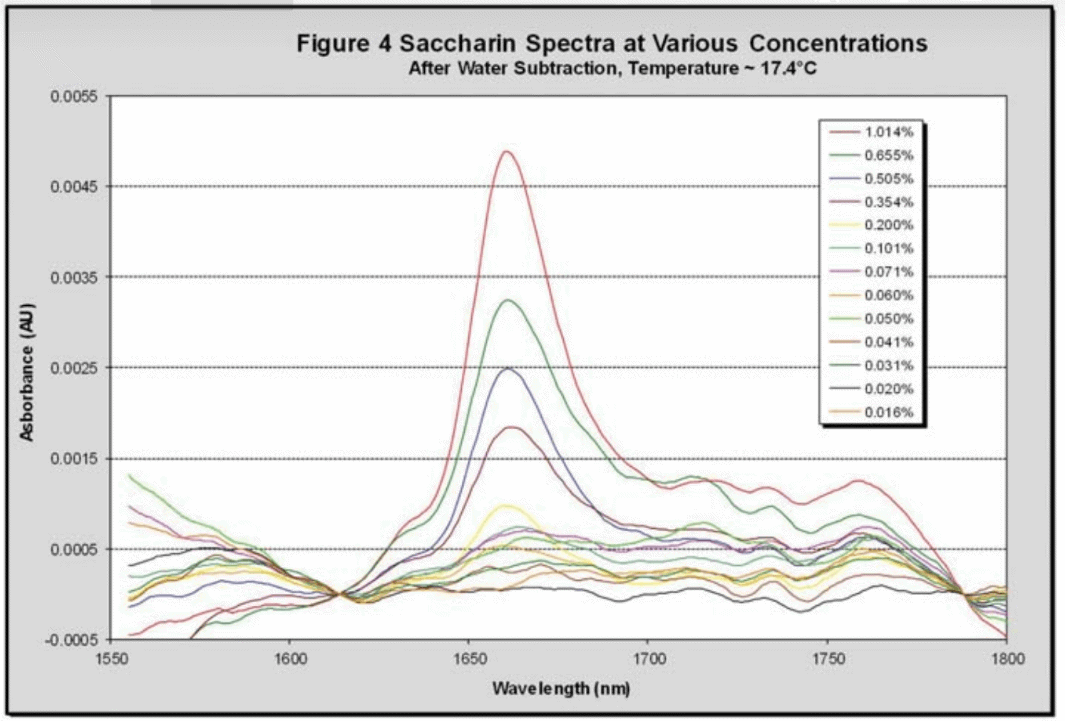
A predicted temperature for all of the collected saccharin spectra was calculated using the initial water regression for the DI water sample at 1600 nm vs. temperature. Using the predicted regressions at each wavelength the water baseline was determined and subtracted from each saccharin spectrum to give a spectrum of pure saccharin. Figure 4 shows a collection of these spectra at approximately 17.5 °C
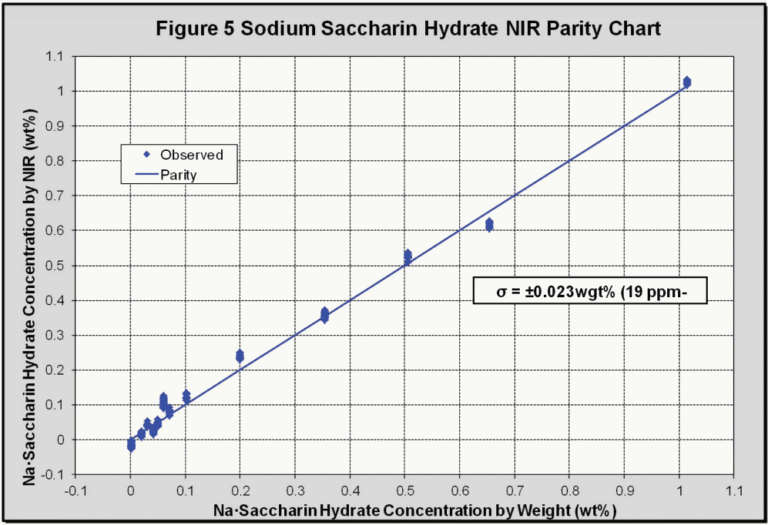
The isolated peak at 1661 nm, corresponding to saccharin, was then regressed against its concentration to give the parity chart (Figure 5), which collates all of the data points (368) at different temperatures and concentrations. The calibration standard error was found to be 0.023 wt% sodium saccharin hydrate, which corresponds to a concentration of 19 ppm. Using a statistically significant conversion factor (3σ) this gives an NIR detection limit of 57 ppm for saccharin in DI water.
Conclusion
Current NIR spectrometers have a very low noise floor, and are highly stable and sensitive; allowing them to be used to measure organics in water solutions of below 100 ppm concentration.
If the conditions are right, water absorptions can be removed from the spectrum without having to use hardware (or similar) which is prohibitively expensive as all the required information is within the spectra.
The method covered in this article can be carried out on-line for process control processes using systems from Process Insights and is also appropriate for molecules of similar structures to saccharin.
Reference
- Todd, T. R. and R. Muegge, “Measuring Low-level Organics in Water using NIR Spectroscopy,” Seventh International Forum Process Analytical Chemistry, Scottsdale, AZ, paper I-034, Jan. 23, 2003.

This information has been sourced, reviewed and adapted from materials provided by Process Insights – Optical Absorption Spectroscopy.
For more information on this source, please visit Process Insights – Optical Absorption Spectroscopy.