Living organisms sustain themselves by relying on proteins known as enzymes to catalyze vital organic reactions. These reactions commence when the substrate (S) gets reversibly bound to the enzyme’s (E) active site to build an enzyme-substrate complex (E-S) with rate constants k1 and k-1. In the next step, the product (P) is released by the enzyme with a rate constant of k2.1 An enzyme-catalyzed reaction’s general reaction scheme is shown by the following equation:

To gain better insights into the behavior of enzymes, it is essential to get a kinetics description of their activity. The Michaelis-Menten model2 is one of the best-known models of enzyme kinetics. This model is defined by the Michaelis-Menten equation, which relates the reaction rate ν (or the rate of the formation of [P]) with the concentration of the substrate [S]:
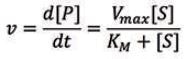
Using the Michaelis-Menten model, two key parameters can be determined — Vmax and KM. Vmax is the maximum product formation rate at a saturating substrate concentration and measures the efficiency of the enzyme’s catalytic potential.3 The Michaelis constant (KM) is the substrate concentration at which the rate of reaction is half of Vmax, and this value is usually used to evaluate the affinity of the active site for the substrate (the KM value is inversely proportional to the affinity).
In general, KM and Vmax are determined by determining an enzyme’s initial reaction rate at several different substrate concentrations. Then, the reaction rate is plotted against concentration to create a Michaelis-Menten plot. The Vmax and KM can be derived from the line of best fit of the Lineweaver-Burk plot by reciprocating both axes on the Michaelis-Menten plot.
This experiment has been adapted from an article by Olsen and Giles,4 where the enzymatic hydrolysis of N-acetyl-L-methionine by porcine acylase (N-acyl-L-aminoacid amidohydrolase) is analyzed. It is possible to readily monitor this reaction using 1H NMR spectroscopy with the NMReady-60. The data acquired from a single reaction can subsequently be used to build a Michaelis-Menten plot and a Lineweaver-Burk plot for a rapid and semi-quantitative enzyme kinetics analysis.
Procedure
Preparing Stock Solutions
Together with 0.112 g of KH2PO4, 0.382 g of N-acetyl-DL-methionine was suspended in 2 mL of D2O. 2 M solution of sodium hydroxide in D2O was carefully added to change the pH to 7 using pH paper. Then, D2O is used to dilute the resulting solution to 5 mL in a volumetric flask. The final solution contained 400 mM of N-acetyl-DL-methionine. Porcine acylase (10 mg) and CoCl2.6H2O (1.5 mg) were dissolved in 10 mL of D2O to prepare a stock solution of the enzyme.
Using the NMReady-60 to Monitor the Reaction
1H NMR spectrum was obtained (spectral center = 5 ppm, spectral width = 20 ppm, number of scans = 16, number of points = 4096, delay = 0.5 seconds) by transferring the N-acetyl-DL-methionine solution (500 µL) to an NMR tube; 100 µL of the enzyme solution is added to the NMR tube and vigorously mixed to initiate the reaction. The kinetics module on the NMReady-60 (number of clusters = 40, wait type = linear, wait time (tau) = 160, wait units = seconds) is used for recording a 1H NMR spectrum every 4 minutes for 2 hours. The progress of the reaction was monitored by measuring the integrals of the α-methine protons for the reactant (N-acetyl-DL-methionine, 4.25 ppm) and the product (L-methionine, 3.85 ppm).
Results
The 1H NMR NMR spectrum of the hydrolysis reaction shown in figure 1 illustrates the depletion of the substrate N-acetyl-DL-methionine (4.25ppm), and the simultaneous appearance of the product L-methionine” rather than "The 1H NMR spectrum of the hydrolysis reaction shown in Figure 1 illustrates the depletion of the substrate, the simultaneous appearance of the product L-methionine (3.85 ppm), and N-acetyl-DL-methionine (4.25 ppm). Of importance is the fact that the signal at 4.25 ppm does not completely disappear if the D-enantiomer of the racemic mixture remains in the solution without being hydrolyzed by the porcine acylase.” To “it is important to note that the signal at 4.25 ppm does not completely disappear, this is due to the presence of the D-enantiomer remaining in solution since it cannot be hydrolyzed by porcine acylase.
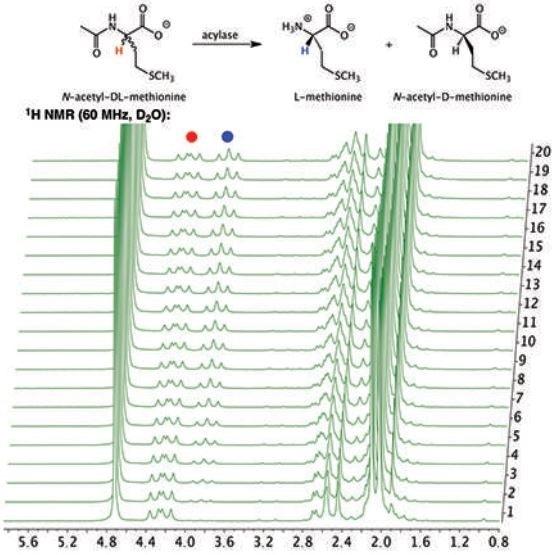
Figure 1. Stacked plot of 1H NMR spectra of the hydrolysis of N-acetyl-DL-methionine by porcine acylase to produce L-methionine.
A plot of the substrate concentration over time is illustrated in Figure 2. It is observed that the substrate concentration reaches a plateau within one hour, this plateau represents the completion of the reaction. The change of the reaction rate as a function of substrate concentration is depicted by the Michaelis-Menten plot in Figure 3. Usually, the Michaelis-Menten experiment is carried out by measuring the reaction rate at a number of initial substrate concentrations; however, in this case, the experiment has been condensed into a single reaction.
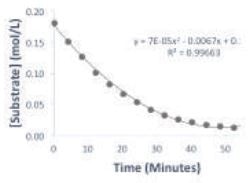
Figure 2. Plot of substrate concentration over time of the reaction.
![Michaelis-Menten plot of the reaction. The data was fitted to V = (Vmax [S]) / (KM + [S]).](https://d12oja0ew7x0i8.cloudfront.net/images/Article_Images/ImageForArticle_17847_44837491904189822974.jpg)
Figure 3. Michaelis-Menten plot of the reaction. The data was fitted to V = (Vmax [S]) / (KM + [S]).
As the reaction proceeds, multiple 1H NMR spectra are obtained, enabling the substrate concentration to be determined from each spectrum and the reaction rate to be approximated by evaluating the difference in substrate concentration over a known time interval. Thus, at higher substrate concentration, it is observed that the reaction rate starts reaching a plateau, representing the Vmax at this substrate concentration.
The Lineweaver-Burk lot shown in Figure 4 is constructed from the Michaelis-Menten plot by reciprocating both the axes. Consequently, KM was found to be 0.24 mol/L and Vmax was found to be −0.3152 mmol L−1 second−1.
![Lineweaver-Burk plot of the reaction. The data was fitted to the equation 1/V = (KM/Vmax [S]) + 1/Vmax from which the values of KM (0.24 mol/L) and Vmax (0.3152 mmol L-1 second-1) were extracted.](https://d12oja0ew7x0i8.cloudfront.net/images/Article_Images/ImageForArticle_17847_44837491908368065716.jpg)
Figure 4. Lineweaver-Burk plot of the reaction. The data was fitted to the equation 1/V = (KM/Vmax [S]) + 1/Vmax from which the values of KM (0.24 mol/L) and Vmax (0.3152 mmol L−1 second−1) were extracted.
Conclusions
This experiment analyzed the enzymatic hydrolysis of N-acetyl-L-methionine. As a result of the variation in the chemical shifts of the α-methine protons in the substrate and the product, it was possible to use 1H NMR spectroscopy to track the progress of the reaction with the NMReady-60 instrument. Moreover, quantitative data obtained from the spectra were used to build a Michaelis-Menten plot and a Lineweaver-Burk plot, which were subsequently used to determine the Vmax and KM values of the enzymatic reaction.
Data Accessibility
The NMReady-60 enables data to be processed directly and printed. It is also possible to export the data directly to a USB or networked file, where it can be manipulated using third-party NMR processing software.
References and Further Reading
- Le H.; Algaze, S.; Tan, E. Michaelis-Menten Kinetics https://chem.libretexts.org/Textbook_Maps/Biological_Chemistry/Catalysts/Enzymatic_Kinetics/Michaelis-Menten_Kinetics (accessed Dec 4, 2018).
- BIanco, A.; Blanco, G. Medical biochemistry; Academic Press: London, United Kingdom, 2017; pp. 153–175.
- Berg, J.; Tymoczko, J.; Stryer, L. Biochemistry; 5th ed.; W.H. Freeman and Co.: New York, 2002.
- Olsen, IR., Olsen, J. and Giles, G. “An Enzyme Kinetics Experiment for the Undergraduate Organic Chemistry Laboratory.” J. Chem, Educ., 2010, 87(9), pp.956–957.

This information has been sourced, reviewed and adapted from materials provided by Nanalysis Corp.
For more information on this source, please visit Nanalysis Corp.