Sponsored by EDAXApr 27 2019
The surface properties of some steel alloys can be adjusted through the introduction of specific elements via diffusion. An example of such a process is nitriding, where nitrogen is diffused into the surface of an alloy to make it stronger and more wear-resistant.
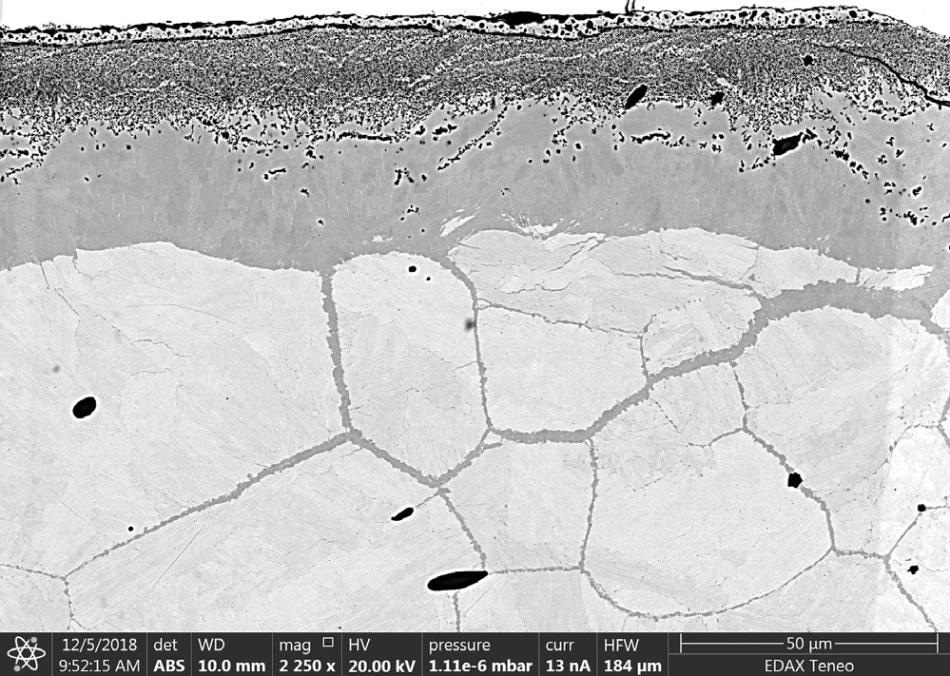
Figure 1. BSE image of the nitrided surface layer of the steel sample.
Nitriding was first developed in the early 20th century and, despite being a matured technology, continues to increase in popularity due to the lower temperature heat treatment requirements compared to alternative technologies. Lower temperatures are advantageous when processing metals as there is a reduced chance of distortion and other associated issues.
Microstructural Characterization of Nitrided Steel Using EBSD and EDS
This article will explore the microstructural characterization of nitrided steel using a combination of Electron Backscatter Diffraction (EBSD) and Energy Dispersive Spectroscopy (EDS).
A Backscatter Electron (BSE) image taken from the nitrided surface of a steel sample is shown in Figure 1. The image contrasts primarily show atomic number or density contrast. The brightest region at the top corresponds to the nickel plating used to help with the mechanical polishing and the bright region towards the bottom corresponds to the steel microstructure.
The darker area between the two bright regions relates to the nitride layer. The black areas are the result of pores close to the edge or precipitates of the samples.
EBSD and EDS Mapping
An EBSD and EDS map of the sample was collected simultaneously over an area of 112 μm x 140 μm using a hexagonal sampling grid with a step size of 125 nm. Simultaneous EBSD and EDS data can be collected using any combination of EBSD and EDS detectors from EDAX. A primary advantage of collecting this data simultaneously is the direct correlation of the two signals on the same collection grid.
During the collection of the EBSD patterns, regions of interest (ROIs) are defined within the imaged phosphor screen, and the intensity variations within these ROIs are utilized to generate maps which show different contrasts resulting from the changes in electron diffraction and scattering signals from the sample onto the phosphor screen. This imaging method is known as PRIAS™.
Figures 2a, 2b, and 2c are images of the top, middle, and bottom ROIs. The contrast of the top ROI is similar to the contrast in the BSE image previously collected (Figure 1). The middle ROI is the orientation contrast within the microstructure, whereas the bottom ROI shows weaker grain contrast and stronger topographical contrast. These images help to provide a comprehensive visual overview of the microstructure.
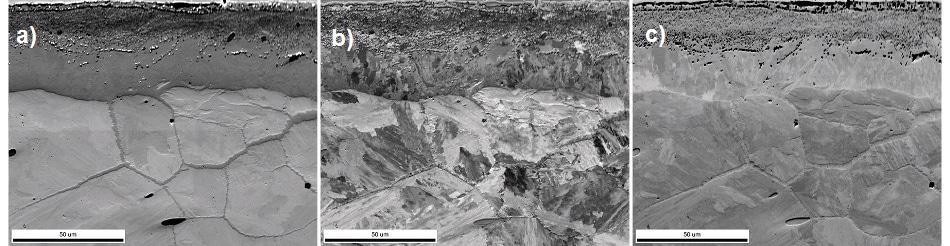
Figure 2. PRIAS™ images from the a) top, b) middle, and c) bottom ROIs showing different microstructural contrasts within the analysis region.
Four primary phases were identified within the mapping area. The steel structure was identified as ferrite. It should be noted that it can be hard to differentiate cubic ferrite from slightly tetragonal martensite or tempered martensite using EBSD, which is why ferrite was selected. Two different iron-nitrogen phases were detected, a cubic γ’ Fe4N and a hexagonal ε Fe3N. A fourth MnS phase was added that matched the primary
intermetallic inclusions present.
Figure 3 shows the phase map collected with these structures. The Fe3N phase (yellow) can be easily identified as it contrasts with the other phases that have cubic structures. The cubic crystal structures of the ferrite and MnS phases and their similar diffracting planes, which produce similar EBSD patterns, make them difficult to distinguish from one another.
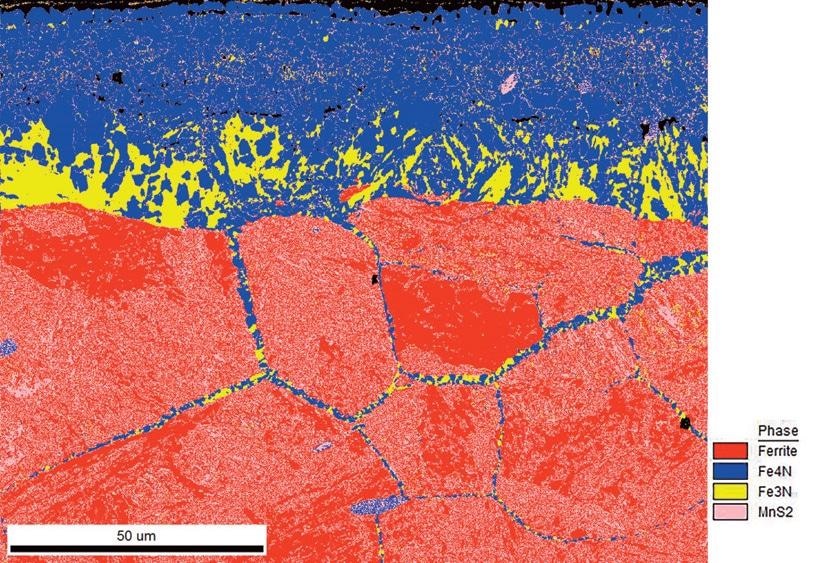
Figure 3. Phase map before ChI-Scan™.
Phase Differentiation Using EDS Data
The inclusion of EDS data, such as that collected by ChI-Scan™, can help researchers differentiate between such phases. EDS is used to determine the local composition of the sample, and this information is used to choose the correct crystallographic structure for EBSD pattern indexing.
Figure 4 shows an RGB EDS color map showing the locations of nitrogen (red), iron (blue), and manganese (green) in the sample. The map makes it easy to identify the location of MnS phases in the steel sample. This method greatly assists in differentiating between phases, as demonstrated in Figure 5 – a phase map following the use of ChI-Scan™.
Following the characterization of the microstructure, the analysis can take place. Figure 5 shows that the outer layer closest to the surface is primarily Fe4N, while the Fe3N
the phase is located closer to the ferritic steel interface. The phase map also indicates that there are veins of mixed Fe-N phases that are penetrating deeper into the ferritic steel matrix.
Figure 6, an EBSD Image Quality and IPF Orientation Map (relative to the surface normal direction), shows that these veins extend through boundaries between prior austenite grain boundaries. This suggests that these prior austenite boundaries are faster diffusion pathways for the nitrogen introduced during the processing.
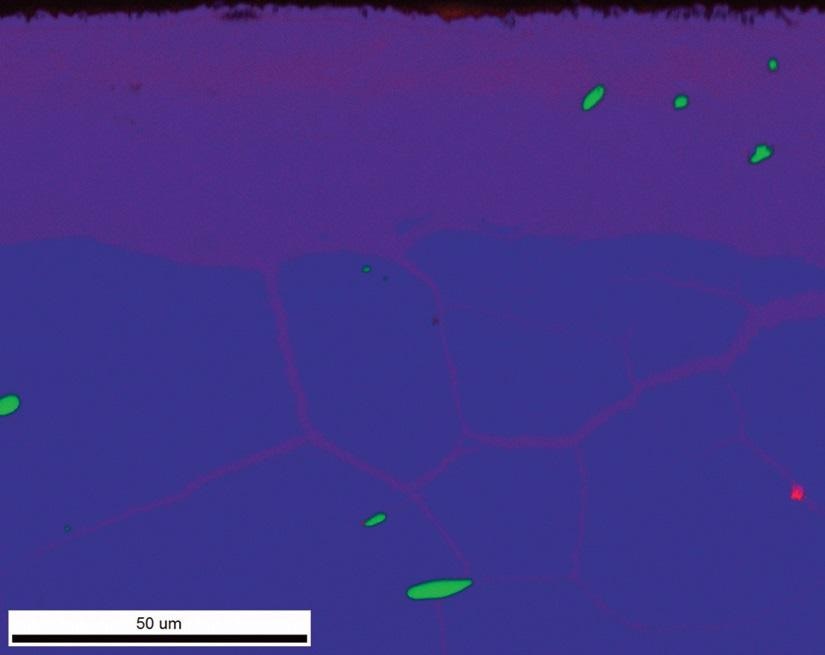
Figure 4. EDS RGB color map, showing iron (blue), nitrogen (red), and manganese (green) superimposed elemental maps.
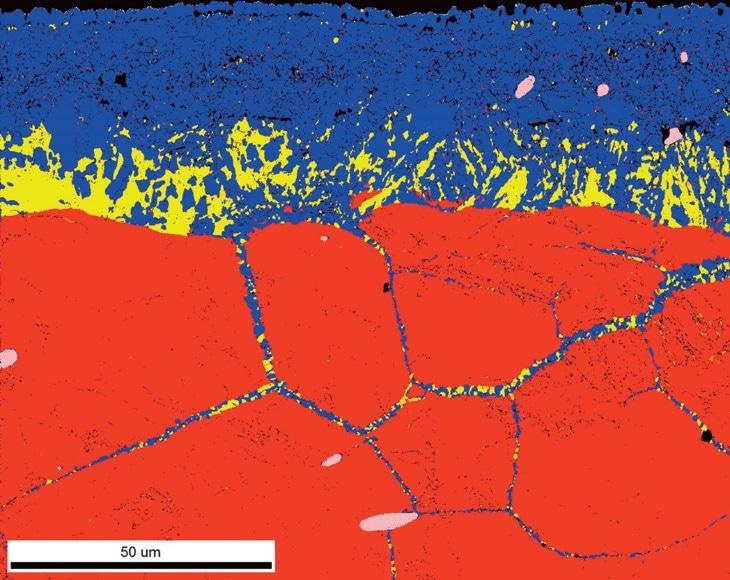
Figure 5. Phase map after ChI-Scan™ is applied.
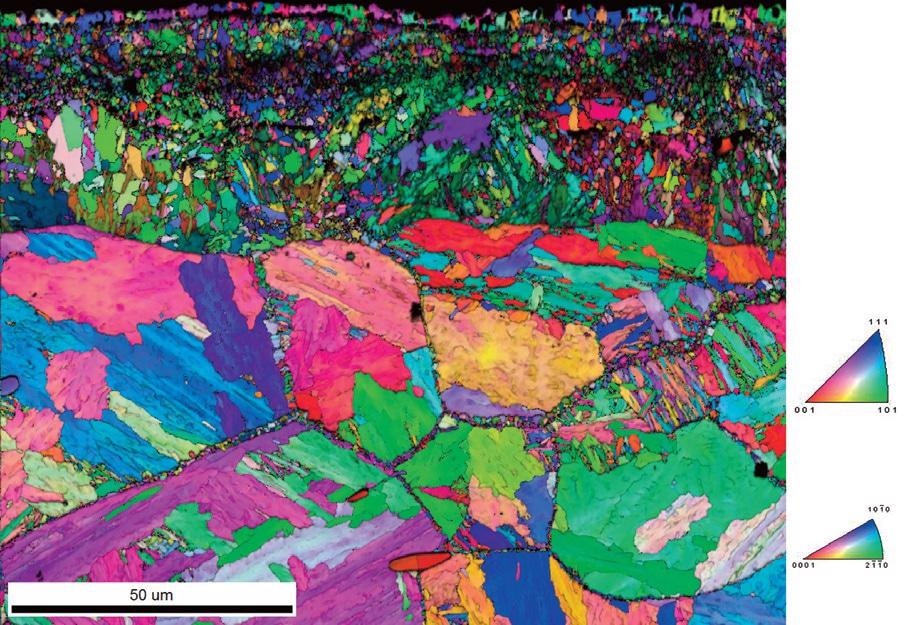
Figure 6. The EBSD Image Quality and IPF Orientation Map (relative to the surface normal direction) shows that the veins of Fe-N phases are extending through the boundaries between prior austenite grain boundaries.
The grain size of each constituent phase can also be calculated, and the spatial distribution of the sizes can be shown within the microstructure. In this case, there is a bimodal grain size distribution within the hexagonal Fe3N phase, with larger grains located closer to the interface with the cubic Fe4N phase and smaller grains near the surface layer and within the inter-packet grains.
Analysis of grain shape is also available, with some regions of equiaxed grains combined with regions of more elongated grains near the steel interface. Information about the grain size and shape can help with understanding the growth kinetics of the nitride layer during processing.
Conclusion
The results covered in this article demonstrate that a combination of EBSD and EDS can be used to characterize, and gain an understanding of, microstructure development during nitriding.
This information can then be used to configure the nitriding parameters for optimal surface case hardening properties and improved materials performance.

This information has been sourced, reviewed, and adapted from materials provided by EDAX, LLC.
For more information on this source, please visit EDAX.