Sponsored by EDAXFeb 9 2023Reviewed by Olivia Frost
Electron Backscatter Diffraction (EBSD) is a widely used microanalysis technique for determining the crystallographic microstructure of a material. The method typically necessitates a substantial sample tilt angle (approximately 70 degrees) to maximize the yield of backscattered electrons that reach the EBSD detector.
This sample geometry can be incompatible with other characterization techniques that are used within a Scanning Electron Microscope (SEM), such as Energy Dispersive Spectroscopy (EDS), which can efficiently collect X-ray data from both flat and highly tilted samples.
Other techniques, such as Wavelength Dispersive Spectrometry (WDS) and Cathodoluminescence (CL), may also be hindered by a tilted sample geometry. These techniques can provide supplementary information to complement EBSD and EDS characterization, but they require a non-tilted sample surface for data acquisition.
Correlative microscopy is an effective approach for combining these various techniques for more comprehensive characterization.
This approach involves collecting datasets from the same region of interest on a sample using each characterization modality, then spatially correlating the data so that each pixel on the sampling grid from the region of interest has data values from each analytical technique of interest.
To facilitate this correlative microscopy, tools for alignment and analysis are available in the OIM Analysis™ Software.
Results and Discussion
To demonstrate the capability of correlative analysis, EBSD and CL data was obtained from a cadmium telluride (CdTe) solar cell material. The CdTe films were produced through radio frequency magnetron sputtering.
Subsequently, the film underwent a 30-minute treatment with CdCl2 in the air at 387 °C to passivate the grain boundary structure and promote the growth of grains within the microstructure.
Due to the roughness of the film, a flat region on the surface was created for analysis through the use of a focused ion beam at a 1-degree glancing angle.
EBSD data was collected using a Velocity™ Super EBSD Detector, operating at 20 kV and 2,000 indexed points per second at 20 kV beam energy and 6.4 nA beam current at 70° sample tilt (note the required 68.5° stage tilt + 1.5° from the FIB glancing angle into the surface).
CL data was obtained from the same area using a Gatan Monarc Pro CL System. A hyperspectral map was collected from 700 nm to 1100 nm with a 0.2-second dwell time.
The data was visualized using DigitalMicrograph®. A primary Gaussian peak at 807 nm was detected, and a greyscale picture was created utilizing this wavelength as well as the Secondary Electron (SE) image gathered with the CL data.
Within the OIM Analysis program, a correlative microscopy tool allows for the correlation of pictures from various methods with EBSD data. The 807 nm CL and SE pictures were chosen for correlation in this scenario.
The intensity range of this data can be associated with each image. A Quadratic Bivariate correlation method is used to establish a spatial correlation between these maps and the EBSD data, which requires the identification of at least nine features in both the correlated and EBSD data.
In this particular case, the SE maps collected during both acquisitions were used, as the structure contained voids that were easily identifiable in both images. This approach enables the correlated data to be mapped to the EBSD data, and it does not mandate that the same sampling step size be used for both techniques.
Figure 1 shows the associated SE images from the EBSD and CL scans, indicating the acquired correlative alignment.
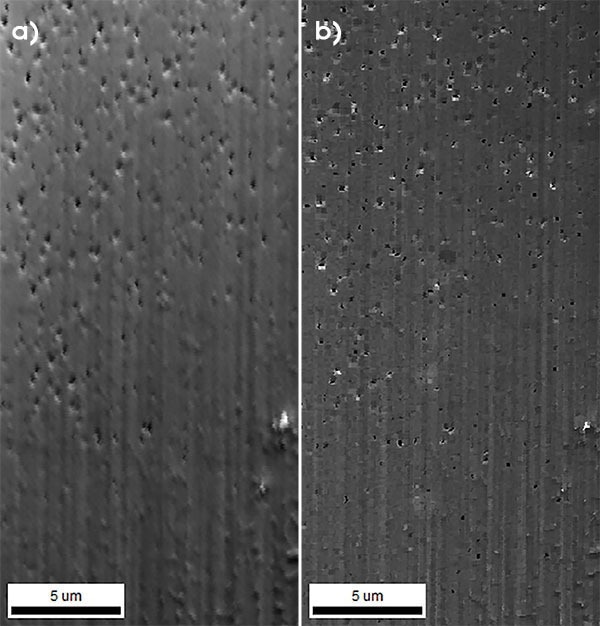
Figure 1. Correlated SE images from a) EBSD and b) CL acquisitions. Image Credit: EDAX.
Figure 2 illustrates the EBSD grain map, where grains are identified from the measured orientations and then randomly colored to display grain morphology. A grayscale image of the correlated CL map at the 807 nm wavelength emission, generated from the correlated values in OIM Analysis, is shown in Figure 3.
The CL detector captured this map of the intensity of light at this wavelength. The light was generated by the recombination of charge carriers within the CdTe material and is expected to be correlated to the primary band gap of the material.
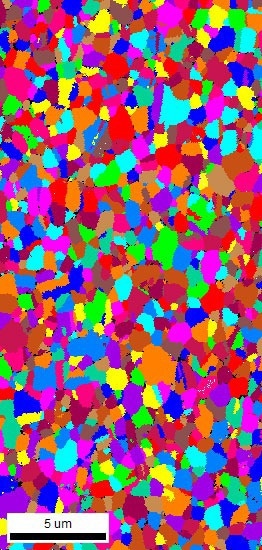
Figure 2. EBSD grain map, where grains are determined from the measured orientations and then randomly colored to show grain morphology. Image Credit: EDAX.
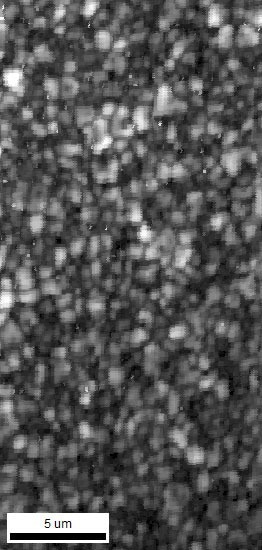
Figure 3. Grayscale image of the correlated CL map of the 807 nm wavelength emission, generated from the correlated values in OIM Analysis. Image Credit: EDAX.
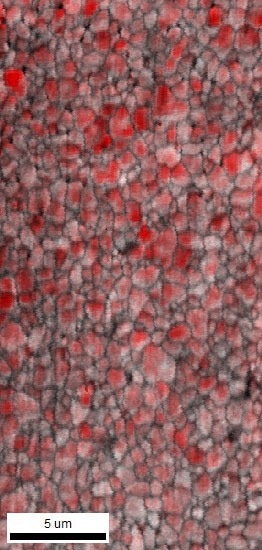
Figure 4. The EBSD and CL data are visualized together in this EBSD Image Quality map with grayscale contrast. The CL intensity data at 807 nm is colored using a white-to-red coloring scheme across the intensity distribution. Image Credit: EDAX.
Figure 4 illustrates the visualization of the EBSD and CL data together. This image shows the EBSD Image Quality map with grayscale contrast while the CL intensity data at 807 nm is colored using a white-to-red scheme across the intensity distribution.
The correlation of the data enables the analysis of relationships between the EBSD and CL data. For instance, the highlighting tool within OIM Analysis can be used to measure the CL intensity across different grain boundary types in the microstructure.
In this example, it was observed that random high-angle grain boundaries had lower CL signal levels than twin boundaries within the CdTe.
These findings suggest that twin boundaries improve the CdTe conversion efficiency by reducing the number of charge recombination sites within the material. Additionally, the CL signal can be correlated with crystallographic orientation.
Figure 5 depicts a scalar texture Inverse Pole Figure (IPF) plot of the CL intensity values as a function of orientation. This map reveals a relationship between crystal orientation and CL signal intensity, with the (001) orientation relative to the surface-normal direction exhibiting higher CL intensities.
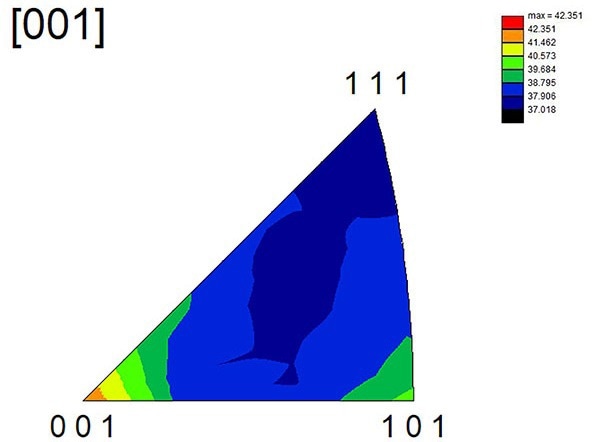
Figure 5. A scalar texture IPF plot of the CL intensity values as a function of orientation. Image Credit: EDAX.
Conclusion
This application demonstrates how valuable data can be obtained from the correlation of CL and EBSD data and the significance of correlative microscopy in general.
CL is particularly useful as it allows for detailed measurements of compositional uniformity and defect concentrations, which are important properties of solar cell materials. EBSD, on the other hand, offers crystallographic microstructure characterization to complement these measurements.
The correlative features within the OIM Analysis software provide powerful tools for aligning, visualizing, and measuring the relationships between these analytical techniques, ultimately providing new perspectives on material performance.

This information has been sourced, reviewed and adapted from materials provided by EDAX.
For more information on this source, please visit EDAX.