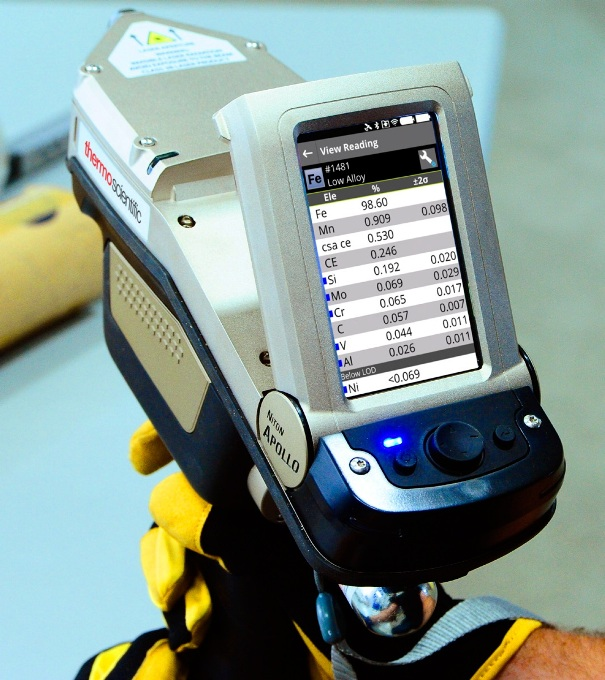
The Thermo Scientific™ Niton™ Apollo™ handheld LIBS analyzer is designed for the most challenging applications. When high sample throughput and low detection limits are essential, the Niton Apollo’s blend of software and hardware offers the user solutions built to perform against the most demanding analytical requirements.
The Niton Apollo uses laser induced breakdown spectroscopy (LIBS), to precisely measure carbon in about 10 seconds. With a weight of only 6.4 lbs. (2.9 kg.), the Niton Apollo converts the conventional laboratory, or cart-mounted Optical Emission Spectroscopy (OES) system, into a handheld analyzer that is highly mobile.
The Importance of Sample Preparation
The correct preparation of samples is crucial to acquire dependable results when deploying the Niton Apollo. Unreliable results may be generated if trace amounts of contaminants are present, for example, grease, scale or paint.
This is due to the laser used in the Niton Apollo which ablates the sample’s surface. Only a small amount of the sample (several nanograms) is removed when this happens. If the surface is diluted, then the sample of the metal will not be representative and cannot offer accurate results.
Instrument Performance
The results detailed have been gathered from samples that were correctly prepared and show the highest performance expected of the Niton Apollo. Accuracy and precision are common ways of measuring the performance of an instrument.
Accuracy is measured by evaluating the similarities of the read values (concentration) to the true or certified value. Precision is determined by how close several measurements are to each other on any particular sample. Accuracy relies on the preparation of the sample and instrument calibration.
Precision depends on both the performance of the instrument regarding stability and also on the uniformity of the investigated sample. Spot to spot variation can be produced as a result of the small amount of material being ablated which increases (worsens) the measured precision.
It is suggested that a minimum of three or more analyses are carried out and the results are averaged. If questionable burns occur, they can be deleted by the user. The Niton Apollo has an average screen that is simple to read (Figure 1).
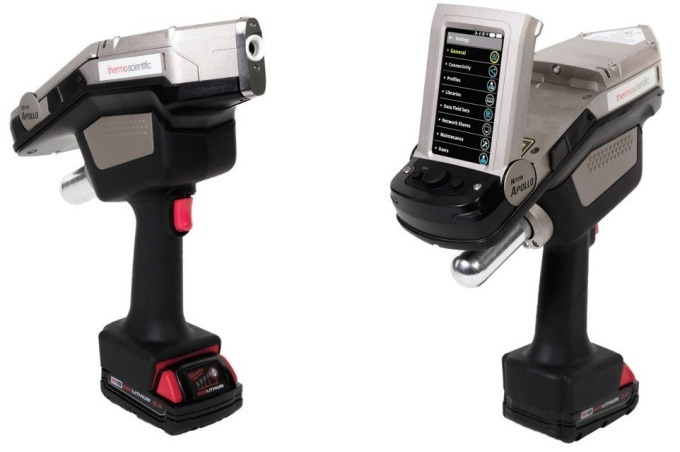
Figure 1.
The on-board carbon equivalency (CE) equation is established on the formula offered by the International Institute of Welding (IIW), but any alternative CE calculations can be conveniently inputted by the user (Figure 2).
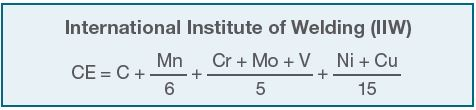
Figure 2.
The next examples demonstrate the standard performance of the instrument in regards to reproducibility (between instruments) and repeatability (performance of the individual instrument).
Reproducibility
Tables 1 to 3 show a comparison of several instruments (an average of six readings from 12 instruments) presenting the typical accuracy and average recovery (a sign of proximity to the true value).
| Sample SPL-LA-2d |
| Instrument |
C |
Mn |
Cr |
Ni |
Mo |
Cu |
Al |
Si |
V |
CE |
| 1 |
.074 |
.254 |
.118 |
2.02 |
.535 |
.539 |
.171 |
1.50 |
.275 |
.473 |
| 2 |
.069 |
.251 |
.156 |
2.00 |
.574 |
.542 |
.169 |
1.44 |
.284 |
.483 |
| 3 |
.080 |
.253 |
.124 |
1.89 |
.502 |
.586 |
.154 |
1.54 |
.265 |
.465 |
| 4 |
.063 |
.235 |
.162 |
2.04 |
.524 |
.533 |
.168 |
1.61 |
.252 |
.461 |
| 5 |
.079 |
.252 |
.127 |
1.87 |
.575 |
.545 |
.179 |
1.54 |
.293 |
.481 |
| 6 |
.083 |
.262 |
.125 |
1.93 |
.568 |
.562 |
.170 |
1.61 |
.274 |
.486 |
| 7 |
.078 |
.256 |
.117 |
1.98 |
.525 |
.542 |
.165 |
1.52 |
.259 |
.469 |
| 8 |
.055 |
.251 |
.114 |
1.85 |
.568 |
.525 |
.155 |
1.47 |
.290 |
.450 |
| 9 |
.060 |
.234 |
.122 |
2.08 |
.545 |
.583 |
.173 |
1.47 |
.283 |
.467 |
| 10 |
.070 |
.249 |
.131 |
1.97 |
.575 |
.511 |
.169 |
1.59 |
.284 |
.476 |
| 11 |
.056 |
.221 |
.114 |
2.03 |
.552 |
.522 |
.174 |
1.49 |
.280 |
.452 |
| 12 |
.066 |
.243 |
.122 |
2.03 |
.545 |
.525 |
.175 |
1.50 |
.293 |
.469 |
| Average |
.069 |
.247 |
.128 |
1.97 |
.549 |
.543 |
.169 |
1.52 |
.278 |
.469 |
| Certified |
.065 |
.26 |
.135 |
2.00 |
.57 |
.53 |
.18 |
1.48 |
.30 |
.478 |
| Avg Rec % |
106.9 |
94.9 |
94.6 |
98.7 |
96.3 |
102.4 |
93.6 |
103.0 |
92.6 |
98.2 |
Table 1.
| Sample IARM 259a |
| Instrument |
C |
Mn |
Cr |
Ni |
Mo |
Cu |
Al |
Si |
V |
CE |
| 1 |
.477 |
.436 |
3.04 |
.193 |
1.36 |
.081 |
.018 |
.441 |
.294 |
.473 |
| 2 |
.476 |
.424 |
3.36 |
.212 |
1.50 |
.086 |
.018 |
.443 |
.303 |
.483 |
| 3 |
.505 |
.491 |
3.41 |
.211 |
1.57 |
.071 |
.014 |
.478 |
.304 |
.465 |
| 4 |
.504 |
.384 |
3.33 |
.219 |
1.31 |
.083 |
.018 |
.467 |
.264 |
.461 |
| 5 |
.496 |
.423 |
3.12 |
.191 |
1.45 |
.080 |
.010 |
.459 |
.319 |
.481 |
| 6 |
.468 |
.423 |
3.15 |
.207 |
1.41 |
.092 |
.017 |
.503 |
.283 |
.486 |
| 7 |
.517 |
.423 |
3.10 |
.188 |
1.39 |
.079 |
.022 |
.462 |
.280 |
.469 |
| 8 |
.449 |
.434 |
3.37 |
.181 |
1.44 |
.080 |
.017 |
.481 |
.294 |
.450 |
| 9 |
.515 |
.409 |
3.29 |
.204 |
1.48 |
.087 |
.019 |
.453 |
.309 |
.467 |
| 10 |
.513 |
.419 |
3.28 |
.190 |
1.35 |
.078 |
.019 |
.474 |
.299 |
.476 |
| 11 |
.484 |
.426 |
3.45 |
.224 |
1.30 |
.083 |
.015 |
.438 |
.251 |
.452 |
| 12 |
.501 |
.417 |
3.09 |
.204 |
1.44 |
.081 |
.015 |
.452 |
.299 |
.469 |
| Average |
.492 |
.426 |
3.25 |
.202 |
1.42 |
.082 |
.017 |
.463 |
.292 |
.469 |
| Certified |
.479 |
.399 |
3.27 |
.194 |
1.43 |
.081 |
.016 |
.44 |
.256 |
.478 |
| Avg Rec % |
102.7 |
106.7 |
99.4 |
104.1 |
99.0 |
100.9 |
104.8 |
105.1 |
113.9 |
98.2 |
Table 2.
| Sample BS 70b |
| Instrument |
C |
Mn |
Cr |
Ni |
Mo |
Cu |
Al |
Si |
V |
CE |
| 1 |
.415 |
1.02 |
1.09 |
.270 |
.216 |
.122 |
.021 |
.251 |
.873 |
.473 |
| 2 |
.363 |
.908 |
1.06 |
.261 |
.240 |
.131 |
.021 |
.254 |
.803 |
.483 |
| 3 |
.413 |
.888 |
1.08 |
.248 |
.198 |
.125 |
.018 |
.275 |
.845 |
.465 |
| 4 |
.442 |
.852 |
1.15 |
.253 |
.203 |
.121 |
.016 |
.275 |
.882 |
.461 |
| 5 |
.420 |
.951 |
.91 |
.239 |
.243 |
.118 |
.020 |
.271 |
.833 |
.481 |
| 6 |
.390 |
.965 |
1.08 |
.252 |
.226 |
.140 |
.026 |
.294 |
.841 |
.486 |
| 7 |
.429 |
.950 |
1.05 |
.238 |
.210 |
.126 |
.013 |
.258 |
.865 |
.469 |
| 8 |
.344 |
.988 |
1.01 |
.210 |
.246 |
.124 |
.017 |
.266 |
.783 |
.450 |
| 9 |
.405 |
.935 |
1.06 |
.260 |
.205 |
.131 |
.020 |
.274 |
.839 |
.467 |
| 10 |
.417 |
.975 |
1.06 |
.229 |
.251 |
.114 |
.021 |
.269 |
.867 |
.476 |
| 11 |
.417 |
.916 |
1.04 |
.262 |
.221 |
.122 |
.017 |
.265 |
.848 |
.452 |
| 12 |
.400 |
.862 |
1.03 |
.245 |
.212 |
.124 |
.021 |
.262 |
.813 |
.469 |
| Average |
.404 |
.934 |
1.05 |
.247 |
.223 |
.125 |
.019 |
.268 |
.841 |
.469 |
| Certified |
0.40 |
.90 |
1.00 |
.25 |
.205 |
.13 |
.024 |
.27 |
.816 |
.478 |
| Avg Rec % |
101.1 |
103.8 |
105.2 |
98.9 |
108.7 |
96.2 |
80.2 |
99.3 |
103.1 |
98.2 |
Table 3.
Repeatability
Several samples were analyzed 80 times over the course of around 4 hours to establish the stability of each distinct instrument.
The following charts provide examples of the repeatability of single instruments. They all demonstrate good precision, for chromium (Cr), silicon (Si), and carbon (C) in a range of certified reference materials (Charts 1-3).
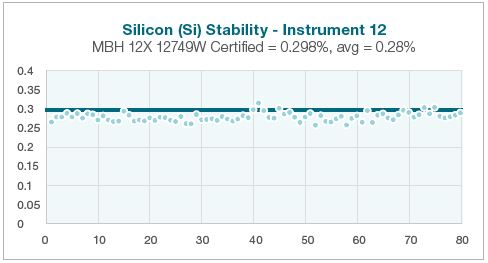
Chart 1.
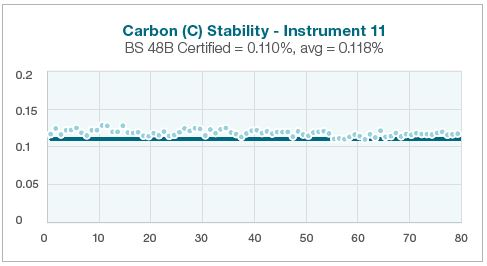
Chart 2.
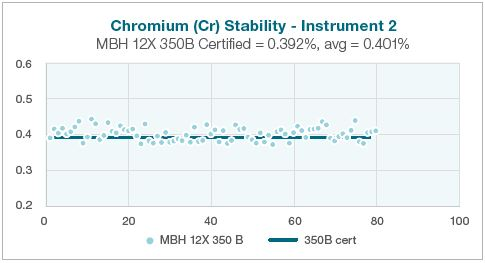
Chart 3.
Standard maximum limits of detection (LODs) in ppm for low alloy samples are shown in Table 4. The results may differ from alloy to alloy.
| Element |
LOD |
| Al |
400 |
| C |
200 |
| Cr |
200 |
| Cu |
150 |
| Mn |
500 |
| Mo |
400 |
| Ni |
700 |
| Si |
350 |
| Ti |
100 |
| V |
200 |
| W |
1300 |
Table 4.
Summary
The Niton Apollo handheld LIBS analyzer accurately and efficiently identifies the content of carbon along with a range of different elements in alloys and metals.
Users can conveniently travel up pipelines, or into trenches because of its portable, convenient form factor. The data is shown in real time, allowing efficient and quick decision making in the field.

This information has been sourced, reviewed and adapted from materials provided by Thermo Fisher Scientific – Handheld Elemental & Radiation Detection.
For more information on this source, please visit Thermo Fisher Scientific – Handheld Elemental & Radiation Detection.