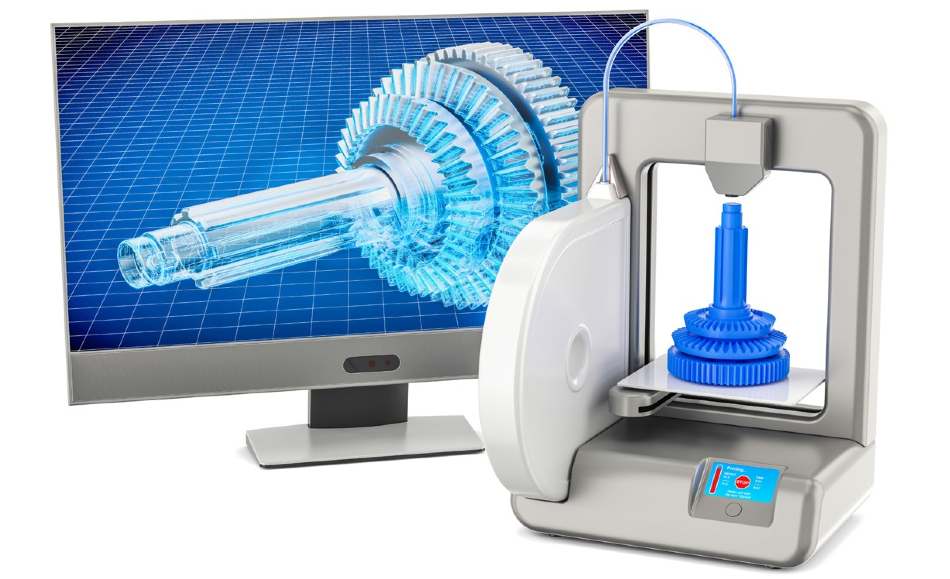
Demand for complex metallic parts is increasing rapidly as a result of fast technological progression. The complexity of parts for use in traditional processing methods for metals is limited, but a newly-evolving solution to this problem is an additive manufacturing (also called 3D printing).
In additive manufacturing, parts are printed layer by layer from metal powders as a “dye”, melting the powder with a laser or an electric arc. Using additive manufacturing, there is no longer any limit to the complexity of parts available. However, it is important that the quality of the raw material is carefully controlled to ensure the mechanical quality of the products.
TC4 (Ti64, Ti-6Al-4V) is the most widely used Ti alloy and has found application in the aerospace industry, and in implants and prostheses, for example. Powders are produced by melt spraying of educts, which can result in variations in composition or oxidation of the sprayed melt. This results in inhomogeneous elemental composition throughout certain batches of powders or contaminations with oxides and variations in crystallite size.
This inhomogeneity has the potential to have detrimental effects on the mechanical quality of manufactured parts. But, using X-ray diffraction (XRD) and energy-dispersive X-ray fluorescence spectroscopy (EDXRF) in conjunction with one another facilitates effective control of oxidation, the crystallite size (CS) and elemental composition in raw powders.
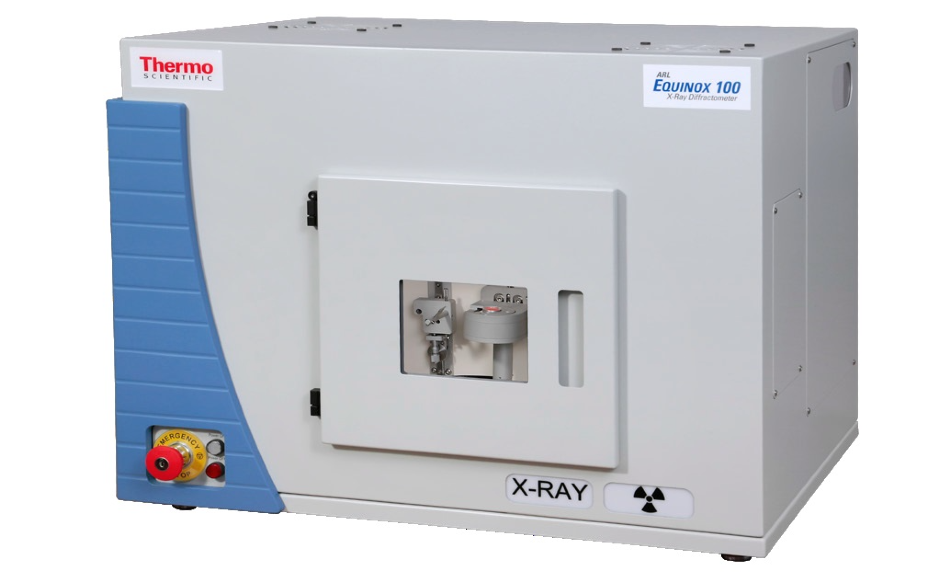
Figure 1. ARL EQUINOX 100 X-Ray Diffractometer. Fast, real-time, and convenient.
Advantages of the Thermo Scientific ARL EQUINOX 100 X-Ray Diffractometer
The Thermo Scientific™ ARL™ EQUINOX 100 X-ray Diffractometer uses a custom-designed Cu (50 W) or Co (15 W) micro-focus tube with mirror optics. External water chillers and other peripheral infrastructure are no longer needed due to the low-wattage system, which allows the instrument to be transported both between laboratories and from the lab to the field with ease.
The ARL EQUINOX 100 Diffractometer (cf. Figure 1) offers rapid data collection times compared to conventional diffractometers due to its unique curved position sensitive detector (CPS), which measures all diffraction peaks in real-time simultaneously.
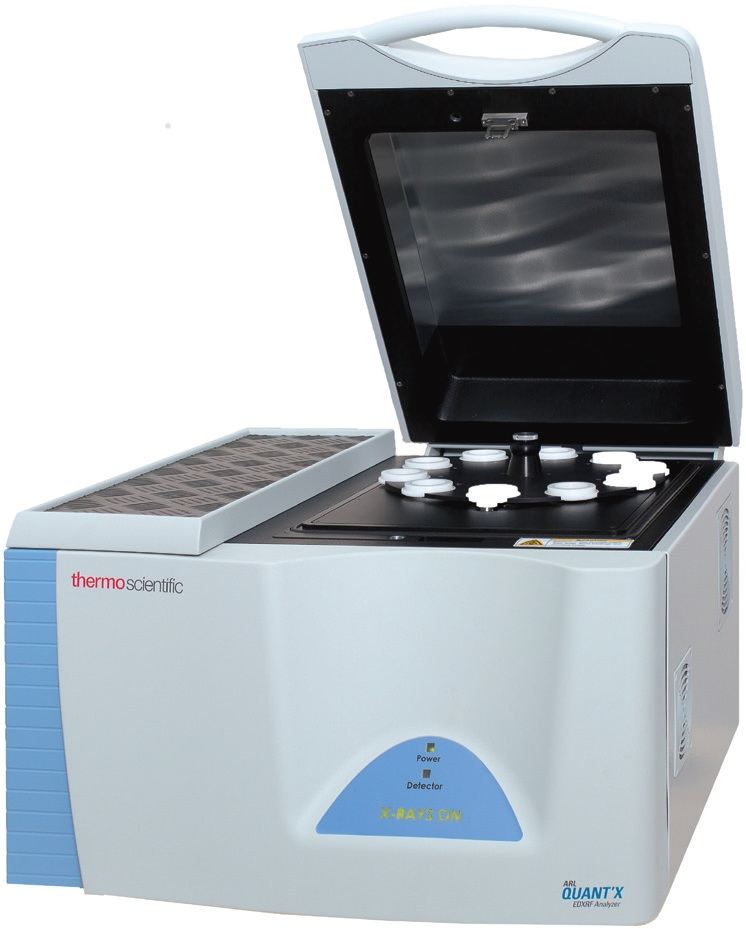
Figure 2. ARL QUANT'X EDXRF Spectrometer.
The Thermo Scientific™ ARL™ QUANT’X Energy-Dispersive XRF Spectrometer utilizes a highly sensitive, silicon drift detector (SDD) to discriminate between incoming radiation energy and can measure all elements between Na (Z=11) and Am (Z=95) as a result. It is equipped with a 50 W Rh or Ag tube, that is operational at voltages up to 50 kV. The conversion of spectra into elemental or oxide concentrations can be achieved with the fundamental parameters (FP), based on the Thermo Scientific™ UniQuant Software standard-less package.
Its rugged and compact design combined with low demand on peripheral infrastructures means that the ARL QUANT’X Spectrometer is a perfect solution for industrial environments.
Case Study
TC4 powder samples were measured in reflection geometry for 5 minutes under CuKα radiation for measurements of XRD. Qualitative and quantitative analyses were completed with MDI JADE 2010 and the ICDD PDF4+ database.
EDXRF tests were carried out on powder samples in a sample cup that was sealed with a 4-micron thick prolene film under He atmosphere. The results of the EDXRF semi-quantitative analysis were gathered with the exclusive UniQuant Software.
Results
XRD analysis (c.f. Figure 3) of the TC4 sample clearly demonstrates a Ti-Al alloy (Ti0.85Al0.15) and some V11O16 (c.f. Table 1). Typically, Ti64 consists of α- (stabilized by Al) and β- (stabilized by V) Ti alloys. However, in this particular sample, only the α-Ti phase is present, and β-Ti is completely missing as V is found as V11O16.
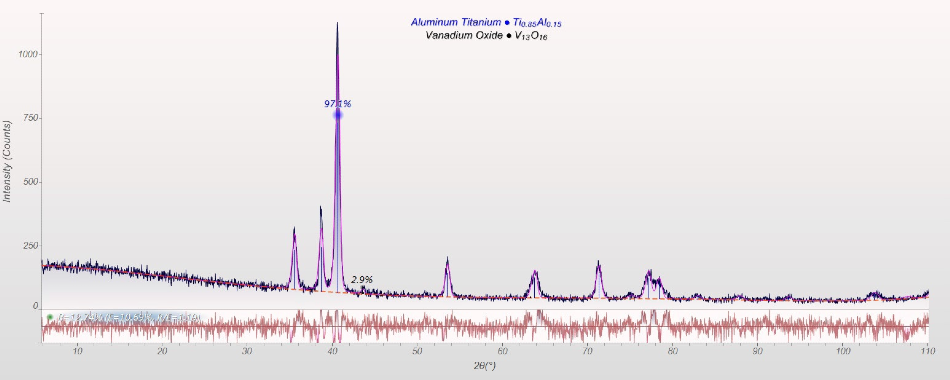
Figure 3. Diffraction patterns of Ti64 measured with Cu-Kα radiation.
The elemental composition taken from XRD yields 2.1 wt percent V, which is already nearing the certified concentration of 3.5 - 4.5 wt percent for TC4. Scherrer’s equation yields a CS of 18.8 nm for the Ti-alloy and 31.4 for V11O16. This is notably low when compared to the specified particle size between 20 and 60 µm.
Due to the fact that Scherrer’s equation only yields the size of scattering domains, the particles may be made up of several crystallographic independent crystallites that stick together. EDXRF analysis results generated with UniQuant Software can be seen in Table 2.
As indicated by the XRD analysis, the main alloy elements are Ti, Al, and V. In addition, Fe is detected at 2.5 wt percent, along with some Cr at 1.0 wt%. Typically, Fe and Cr are not present in Ti64 at these levels of concentration: Fe is generally present at less than 0.3 wt percent, while Cr is at less than 0.1 wt percent if it is present at all.
The presence of these elements suggests the occurrence of cross-contamination during the powder’s production. EDXRF makes for a powerful solution as a QC/QA tool and also facilitates the detection of trace elements that are not widely accessible using XRD.
Table 1. Phase composition from Rietveld refinement.
| Phase (in wt%) |
Composition (in wt%) |
| Ti0.85Al0.15 |
97.1 |
| V13O16 |
2.9 |
Table 2. EDXRF analysis results in Ti64 sample.
| Element |
Conc. (wt%) |
1-sigma (wt%) |
| Ti |
83.63 |
0.19 |
| Al |
8.49 |
0.14 |
| V |
3.61 |
1.36 |
| Fe |
2.50 |
0.08 |
| Cr |
1.00 |
0.07 |
| Mg |
0.371 |
0.059 |
| Ni |
0.130 |
0.006 |
| Mo |
0.100 |
0.001 |
| Mn |
0.096 |
0.026 |
| Co |
0.035 |
0.015 |
| Cu |
0.018 |
0.002 |
| Zr |
0.016 |
0.001 |
| Sn |
0.006 |
0.001 |
Summary
Using XRD and EDXRF in conjunction with each other allows for the determination of elemental composition, as well as the speciation of TC4 powders. XRD reveals the crystallographic structure of TC4 and clearly indicates oxidation. MDI JADE 2010 used alongside widely available databases offers a user-friendly tool to quantify results.
While generating estimates of concentration in major components is possible with XRD, EDXRF brings a far more extensive and precise quantitative composition of samples. The availability of standardless FP based semi-quantitative software such as the UniQuant Software avoids the need for suitable standards. Therefore, it is possible to detect trace elements that may be present because of cross-contamination, which may have damaging effects on the properties of a material.
Acknowledgments
Produced from materials originally authored by Dr. Simon Welzmiller and Dr. Pascal Lemberge from Thermo Fisher Scientific.

This information has been sourced, reviewed and adapted from materials provided by Thermo Fisher Scientific - Elemental Analyzers and Phase Analyzers.
For more information on this source, please visit Thermo Fisher Scientific - Elemental Analyzers and Phase Analyzers.