The research and development of cathode materials for lithium batteries have slowly gained global attention, thanks to the rapid advancement of new kinds of energy, particularly for smart wearable devices and the vehicle sector.
The development of cost-effective lithium-ion battery cathode materials that deliver high safety performance, have an excellent capacity and offer a long-life cycle is one of the major fields of research.
The attempts made in this field have become the major focus of the battery sector and are in a state of quick development. Statistics have reported that within the vehicle sector, lithium-ion batteries were at a full production schedule at the start of January 2021, and that there was a phenomenal growth in year-end orders.
This consequently caused a shortage of upstream, high performance raw materials, particularly in the supply of cathode materials meant for lithium-ion batteries. Lithium-ion battery cathode materials often contain high nickel ternary materials, lithium carbonate, lithium cobalt oxide and lithium iron phosphate.
The charge and discharge performance of such batteries are directly affected by the particle size and size distribution of all cathode material particles. Hence, when developing and producing these batteries, it is highly crucial to quantify the particle size distribution of lithium-ion battery cathode materials.
Lithium iron phosphate is a cathode material often used in lithium-ion batteries. The particle size distribution of lithium iron phosphate governs the processing and application performance of this material in lithium-ion batteries.
This article describes the use of Bettersizer 2600 laser particle size analyzer to quantify the particle size distributions of five lithium iron phosphate specimens.
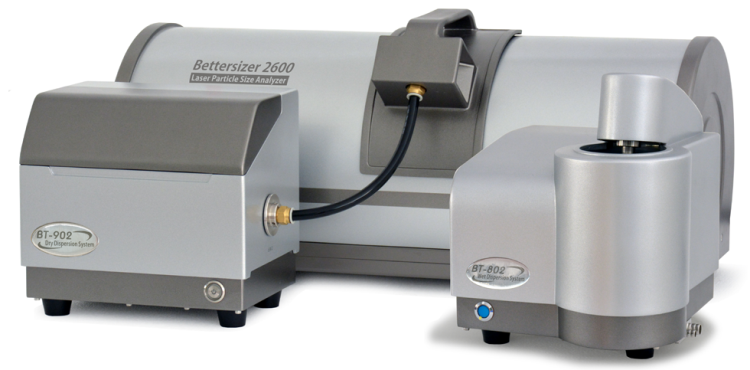
Figure 1. Bettersizer 2600 laser particle size analyzer. Image Credit: Bettersize Instruments Ltd.
Particle Size Distributions of Lithium Iron Phosphate Particles
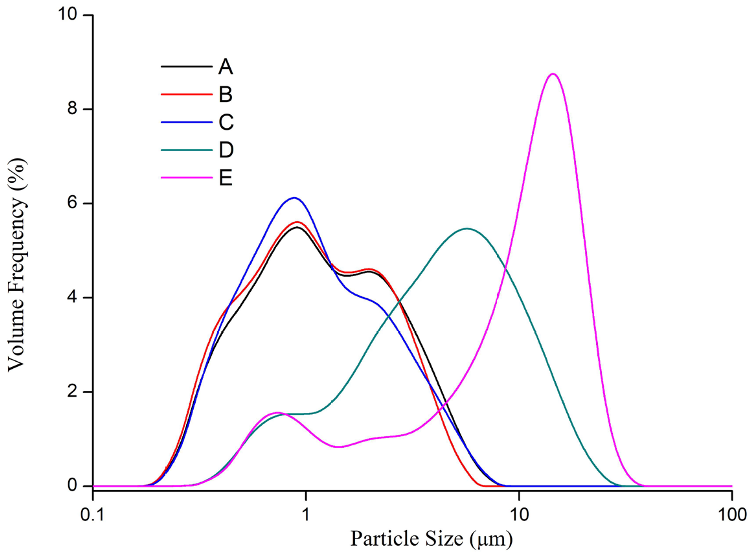
Figure 2. Particle size distribution of lithium iron phosphate particles. Image Credit: Bettersize Instruments Ltd.
Typical Particle Size Values of Lithium Iron Phosphate Particles
As illustrated in Figure 2, the average particle sizes of lithium iron phosphate samples A, B and C were relatively smaller when compared to the average particle sizes of samples D and E. In general, the average particle size of lithium iron phosphate has a major impact on the electrochemical properties of lithium-ion batteries.
Within lithium-ion batteries, small particles can boost the specific surface area of the active materials and reduce the diffusion path of lithium ions in the battery, thereby increasing the electrochemical reactivity of lithium-ion batteries.1
But if the particle size of lithium iron phosphate happens to be extremely small, the particles will agglomerate easily. This results in decreased solid-phase diffusion coefficient and electron conductivity and, as a result, the internal resistance of the lithium-ion batteries increases.
Under the effect of high internal resistance, part of the electric current will be transformed into heat energy. This leads to considerable heat loss from a lithium-ion battery, which eventually impacts the discharge performance and capacity of the battery.
As per the feedback from a leading lithium iron phosphate manufacturer, the majority of the D50s of lithium iron phosphate products range between 1 and 2.5 μm.
The electrochemical characteristics in this size range have been found to work optimally because it is favorable to the successful discharge performance of the lithium-ion battery to achieve optimal levels.
Besides this, the D50s of an insignificant amount of lithium iron phosphate particles range between 3.5 and 8 μm, such as the D and E samples, which results in poor electrochemical characteristics and high internal resistance, thus reducing the usable capacity, estimated lifetime, safety and charge and discharge rates of the lithium-ion battery.
Table 1. Typical particle size values of lithium iron phosphate. Source: Bettersize Instruments Ltd.
| Sample |
D10 (μm) |
D50 (μm) |
D90 (μm) |
| A |
0.388 |
1.057 |
3.126 |
| B |
0.370 |
0.991 |
2.790 |
| C |
0.387 |
0.956 |
2.970 |
| D |
0.973 |
4.228 |
11.150 |
| E |
0.985 |
10.190 |
18.330 |
As shown in Table 1, the average particle sizes of lithium iron phosphate samples A, B and C were around 1 μm, whereas the average particle sizes of samples D and E ranged from 4 to 10 μm.
The oversized particles for sample E are likely to degrade the solid-phase diffusion coefficient of lithium-ion in the active materials, leading to high internal resistance and a decline in effective charge.
Multiple Measurements of the Same Lithium Iron Phosphate Sample
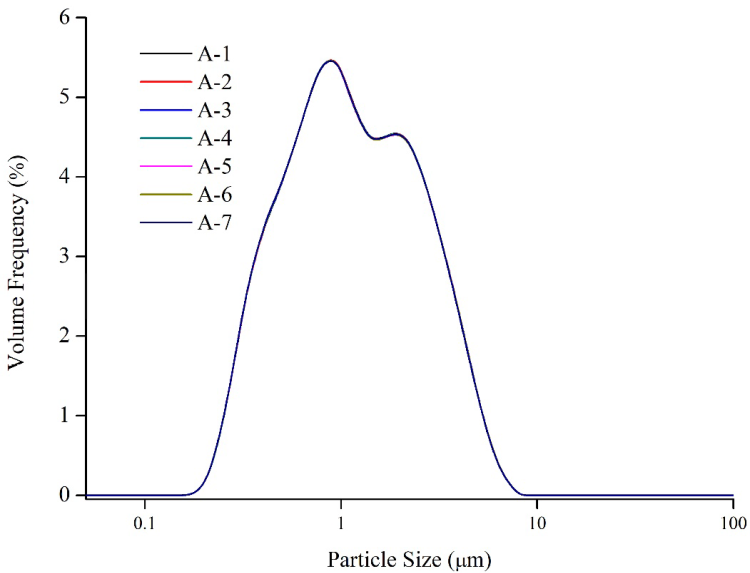
Figure 3. Repeatability test of sample A. Image Credit: Bettersize Instruments Ltd.
Figure 3 shows that the numerous measurements of lithium iron phosphate by the Bettersizer 2600 laser particle size analyzer demonstrate excellent result repeatability. For D10, D50 and D90, the values of repeatability are 0.13%, 0.07% and 0.09%, respectively, and were much below the ISO 13320 requirements.2
Hence, the use of the Bettersizer 2600 laser particle size analyzer to quantify the particle size distribution of lithium iron phosphate offers excellent repeatability.
Conclusion
This article shows how the particle size distributions of the lithium-ion battery cathode materials are crucial in influencing battery performance. The particle size distribution of the cathode material for a given cell size and anode material can be modified to improve the power and energy of lithium batteries.
To achieve safe performance, stability and high energy storage, the particle size distributions of lithium battery cathode materials should be strictly controlled. Hence, battery manufacturers should be able to quantify the particle size distribution of electrode materials easily and rapidly, using the Bettersizer 2600 laser particle size analyzer.
Reference
- Battery materials for ultrafast charging and discharging, B Kang, G Ceder, Nature, 12 March 2009, vol 458.
- ISO 13320 (2009) Particle size analysis – Laser diffraction methods.

This information has been sourced, reviewed and adapted from materials provided by Bettersize Instruments Ltd.
For more information on this source, please visit Bettersize Instruments Ltd.