The most ubiquitous technique for macroscale mechanical characterization of materials is the tensile test. This is because it supplies a full stress strain curve to permit the analysis of such crucial material properties as ultimate strength, yield strength, elastic limit, and work hardening rates.
In situ nanomechanical testing is a powerful group of methods which enable for real-time observation of deformation mechanisms that are directly correlated to load-displacement data. These methods combined with high-resolution electron microscopy and its related chemical and structural analysis methods can supply data which is extremely detailed.
The samples are also small enough to allow the testing of individual microstructural features, like grain boundaries, single grains, fusion zones and heat affected zones, and surface treatment zones.
These methods are highly complementary to traditional bulk scale testing and provide microstructural-level understanding of mechanical behavior. This article outlines utilizing the Hysitron PI 89 SEM PicoIndenter and Tribo iQ application for direct pull tension within an SEM application, including the steps needed for tip and sample fabrication, data analysis and tip alignment.
Direct Pull vs Push-to-Pull Testing
A number of sample geometries exist that can produce different stress states and induce different types of behaviors. Uniaxial tension is usually a good choice as it supplies information on elasticity and yielding like a compression test and it can also supply comparatively better understanding of the material’s ductility.
As a trade-off, whether doing direct pull or push-to-pull (PTP), more preparation time is required for tension tests compared to compression tests. PTP uses a microelectromechanical system (MEMS) device to convert compression into tension1, where a direct pull utilizes a gripper tip to pull a dogbone specimen2.
Push-to-Pull can be run with a conventional flat punch tip but requires either a micromanipulator or float deposition onto the device, whereas a special gripper tip is required for direct pull.
Data correction is needed by subtracting the device stiffness, since the springs of the PTP are in parallel with the sample but this acts to help redirect the force along the tension axis and supplies extra stability for delicate specimens.
Direct pull is more sensitive to misalignment issues but permits numerous samples to be fabricated on one piece and could be used as a higher-throughput method.
Experimental Procedure and Results
A duplex steel sample was employed for this study, which was made up of a mixture of ferrite and austenite phases. A mechanically polished piece was mounted on a PTP-style stub horizontally on the ledge. A lamella can also be fabricated to have a clear view behind the specimens3.
Focused ion beam machining was used to fabricate dogbone specimens via a sequence of cuts. Defining the lamella on the edge region of the sample is the first step in testing.
For this example, a high current beam (65nA) was used to rough out the lamella from the edge-on view, as demonstrated in Figure 1b. The beam current was decreased to 15nA and the lamella was cleaned up, both from the side view and the edge-on view.
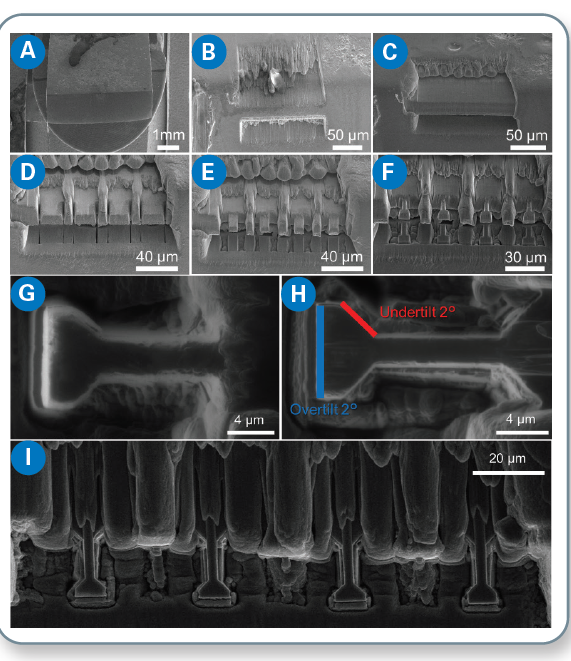
Figure 1. Steps required for FIB machining of dogbone specimens for direct pull tension testing: a) low magnification view of the edge of the sample; b) rough-cut lamella; c) lamella after cleanup; d) sample locations defined on lamella, with some thinning; e) sample locations further reduced to size; f) rough-cut the head and gauge sections; g) side view of rough-cut dogbone; h) after refining, overlay denotes taper correction tilt in i) final samples.
The lamella is then divided up into sections for each of the individual dogbones. Some material is left between each section to block the redeposition of the sputtered material from landing onto the sample next to the one being worked on.
In this example, before a further reduction of the cross-section to a little larger than the maximum width of the dogbone the lamella was then thinned from the edge-on view. This cut only extended into the lamella at around the final sample length. The rough shape of the dogbone sample was cut into this material from here.
This was then refined with even lower current (100pA) cuts and to remove tapering, appropriate over- and under-tilt was utilized which is particularly crucial for the gripped section where the tip makes contact with the sample.
There are numerous ways to fabricate the geometry of the gripped head. Typically, it must be much wider than the gauge section of the specimen, at least 3:1 which helps ensure deformation happens in the gauge.
It must also be at least long enough to stop plastic bending of the ends upwards relative to the center. The transition from the gauge section to the gripped region can be accomplished as a sharp 90 ° transition or with an angle.
The sharp transition has a couple of disadvantages although it is simpler to cut and match between the tip and the sample. One of these disadvantages is that the stress concentration at the transition point from the gauge to the head will be higher than the angled transition, which will influence the nucleation of fracture and plasticity.
The second drawback is that, in the case of slight mis-orientations, the angled contact enables the sample to self-align to the tip more easily. This is because the angled contact is able to generate a lateral force to help center the sample in the gripper.
In comparison, the flat geometry will contact on one side of the sample first, then either this side of the gripped region will deflect, permitting a second contact to be made, or more probable, the gripped region will rotate into contact. The tip must also be carefully fabricated by FIB machining.
Put simply, the negative image of the dogbone head must be fabricated at the end of the gripper tip, but slightly oversized. This permits room for maneuvering the tip into position around the sample and a 60° conical tip was the starting point to achieve this.
Other starting tip shapes could be selected, but this one enables the shape required to be created with minimal removal of material needed. So that the tip can have good clearance to reach the samples, which will be slightly inset with regards to the original bulk material it will also have a diameter which gradually increases, and thus, the width and thickness.
Flattening the end of the cone is the first step in the cutting process. The initial cut for shaping the tip has some overlaid markings from the software measurement tool, as can be observed in Figure 2, to help visualize the final shape of the gripper and determine how far back to cut.
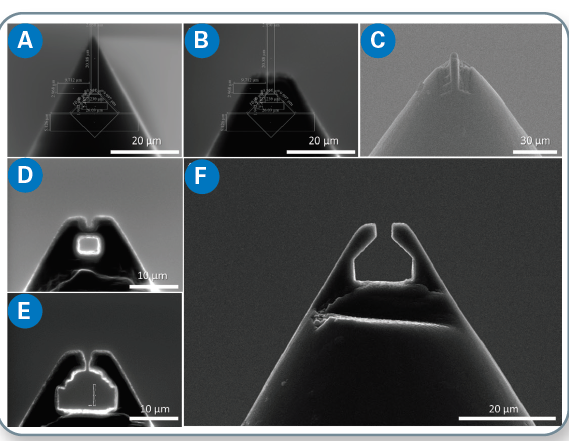
Figure 2. Steps required for FIB machining of a gripper tip for direct pull tension testing: a) conical FIB stock with overlaid SEM measurements showing the gripper geometry; b) end of the conical tip trimmed off; c) turned sideways and thinned; d) initial hole cut into the tip; e) widening the hole by gradual cuts; and f) final gripper tip.
To ensure that it is reasonably robust, it is also crucial to leave some microns of material on the grips. The gripper tip is then thinned; usually, to facilitate sample alignment without being overly large and potentially interfering with the surrounding material, the tip should be twice as thick as the sample.
This could be performed by utilizing an end-on view of the tip, or from the side as shown. The majority of the material has been removed once the tip is thinned and shaping of the gripper region can begin with a decreased beam current.
Cutting a hole through material using a FIB leads to a lot of redeposition, so it is preferable to start by boring a hole which is a lot smaller than the final shape with high current. By cutting away at the sides, this can then be opened up gradually.
The final shaping is performed again using a low beam current and appropriate tilt into the surface being cut to prevent tapering, 2° works well for diamonds. The actual experiments can be performed after the tip and samples are prepared.
For alignment of the tip to the sample, the tip should first be brought over the top or bottom of the sample. This is executed by ensuring the focal plane is different for the samples and tip, then maneuvering the tip into position in the other axes. The tip can then be raised or lowered to the same Z height as the dogbone sample.
The focus can be a good indicator of the height difference, but the final steps of alignment can be more challenging as electron beams have a large depth of focus. Shadowing is the best indicator when they are close together in height and this is caused by the nearby surface partially blocking the escape of secondary electrons.
Figure 3 shows an example of this, where in (b) the focus is close but no shadow is seen but in (c) there is a visible shadow on the right side. If no pre-deformation is applied it is also possible to gently touch the tip and sample together, and employ the force reading as an indication of being well aligned.
Results and Analysis
An example experiment is also shown, with a load-displacement curve and correlated video frames. Initial elastic loading gives a linear slope to the fist point. A large load drop happens and then the load continues to increase with a large slope versus displacement.
This load drop could either be correlated to the nucleation of an initial slip step that requires additional force to become fully activated or to a phase transformation of the austenitic material to martensitic, as this is a duplex steel.
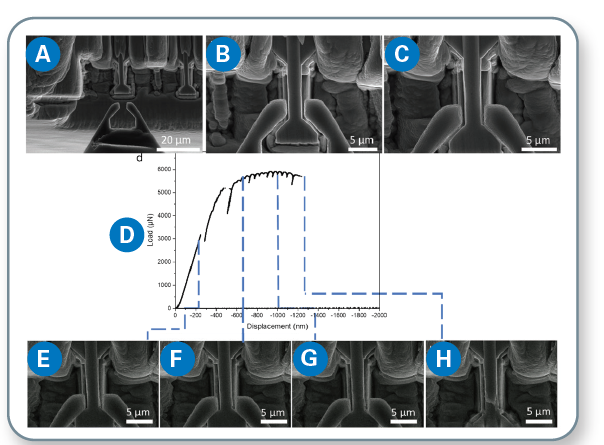
Figure 3. Tip and sample alignment: a) tip and sample at different focal heights; b) tip placed over sample and gradually lowered, the focal plane is similar but still not touching; c) shadow appears signifying the heights are well matched. An example test with d) load-displacement data and correlated video frames (e-h).
In the first case, there would likely be some obstacle to dislocation motion in the interior of the specimen, like a grain boundary. After a second large load drop, eventually more homogenous plasticity is seen, which is correlated to a series of smaller load drops associated with the motion of small bursts of dislocations and/or nucleation of additional parallel slip bands.
In the SEM image necking can be seen. The sample eventually fails in an abrupt manner, with a large load drop. The residual fracture surface resembles that of a cup-and-cone fracture, which is usual for a ductile material. In this example, the necking did not continue for much time before fracture, which shows that the material is giving a mixed ductile-brittle response overall.
The range of transducers available enable the technique presented here to be applied to samples of various compositions and sizes. For reference, the corresponding maximum tensile load for specific transducers is shown in Table 1.
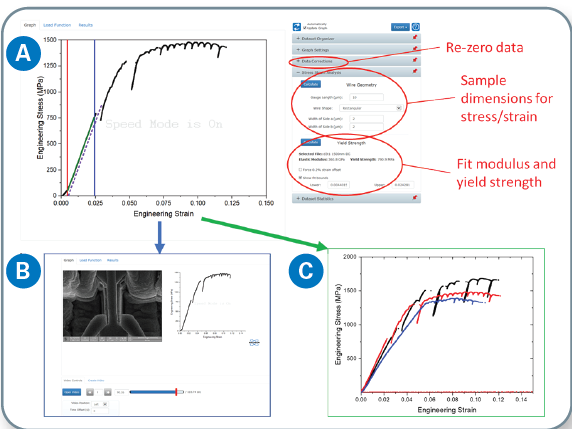
Figure 4. Data analysis with Tribo iQ: a) handling an individual test with application options noted on the right, including analysis of modulus, yield strength, stress/strain calculations and more; b) sideby-side stress/strain data and video frame analysis, with the option to create videos; and c) comparing results from three of the samples in this data set.
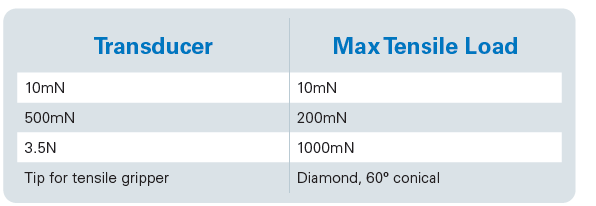
Table 1: Transducers designated by their maximum compression loading, and their corresponding maximum tensile load.
The Tribo iQ analysis application can be used to carry out data analysis. This is designed to enable the rapid creation of individual analysis applications suited to specific experiments. In this instance, the tension analysis app enables data to be loaded, grouped, and graphed in numerous ways.
Essential data manipulation procedures can be quickly and easily applied, these include re-zeroing and machine compliance corrections. By inputting the sample geometry both engineering and true stresses and strains can be calculated, and the yield strength/modulus can be fit by utilizing an offset strain.
Lastly, as shown here for three different dogbone samples, the stress-strain curves can be compared between different samples. The stress-strain curve can also be plotted alongside the video to generate side-by-side stress-strain videos.
Conclusion
Direct pull tension testing in situ SEM is a powerful method which can be used for isolating and characterizing the mechanical response of different microstructural regions of a material. Accompanying electron microscopy provides detailed insights into the prevalent deformation mechanisms and can elucidate structure-property relationships.
The sample and tip preparation routes via focused ion beam machining were demonstrated in detail, together with tip/sample alignment, testing and data analysis. Tribo iQ has applications that are designed to calculate stress and strain easily, while also easily comparing data and making side-by-side videos with mechanical data.
References
1. Chisholm, C., Bei, H., Lowry, M.B., Oh, J., Asif, S.S., Warren, O.L., Shan, Z.W., George, E.P. and Minor, A.M., 2012. Dislocation starvation and exhaustion hardening in Mo alloy nanofibers. Acta Materialia, 60(5), pp.2258- 2264.
2. Kiener, D. and Minor, A.M., 2011. Source truncation and exhaustion: insights from quantitative in situ TEM tensile testing. Nano letters, 11(9), pp.3816-3820.
3. Moser, G., Felber, H., Rashkova, B., Imrich, P.J., Kirchlechner, C., Grosinger, W., Motz, C., Dehm, G. and Kiener, D., 2012. Sample preparation by metallography and focused ion beam for nanomechanical testing. Practical Metallography, 49(6), pp.343-355.