Particle size distribution remains one of the key properties of abrasive grain products. This article explores the use of the Bettersizer ST laser diffraction particle size analyzer in the examination of the particle size distribution of four batches of black silica carbide.
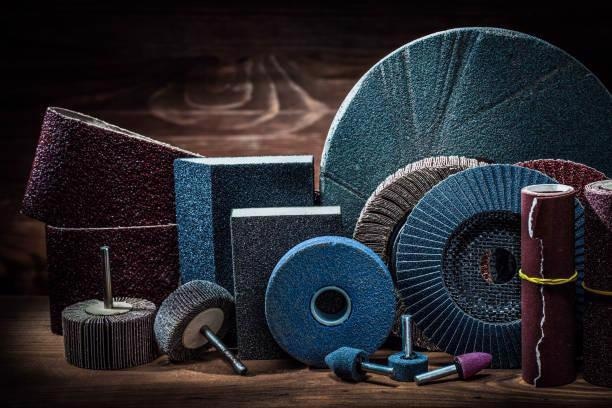
Image Credit: Bettersize Instruments Ltd.
Production process stability may be evaluated via the comparison of abrasive grain products’ particle size distribution. Particle size distribution of various abrasive grain products may also be ascertained, then compared to ISO standards to confirm these meet the required standard.
Naturally occurring minerals exist in numerous forms, including gemstones and abrasives. This article focuses on abrasives - materials that reduce a surface via friction and rubbing.
Natural abrasives include mined diamond, garnet and aluminum oxide, while silicon carbide, diamond and alumina represent examples of synthetic abrasives.
Where possible it is advisable to employ the synthetic form of an abrasive to ensure consistent supply, grain or grit properties. Final abrasives are employed in the manufacture of bonded abrasive products, typically used for surface grinding and polishing. In addition, final abrasive grits can also be used for sandblasting.
Specific properties are responsible for these materials’ suitability as abrasives; for example, sufficient hardness and sharpness are required to reduce another product’s surface, while sufficient toughness is required to withstand the often harsh abrading action.
Any surface treated should exhibit a lower hardness than the abrasive chosen, meaning that it is necessary to employ a high hardness to grind, polish or remove the surface from that material.
The applications of these synthetic abrasives are diverse, typically including chemical or mechanical planarization, or the manufacture of computer and DVR / CD discs, sandpaper or grinding and cutting wheels.
Abrasives may also be used for human skin blemish removal, anti-slip floors, bathroom and kitchen cleaners or silicon wafer production.
Hardness is attributed values using three key scales: Mohs, Vickers and Knoop.
The Mohs scale can be used to ascertain which material will scratch another. The Vickers and Knoop scales utilize a shaped diamond to produce an indentation, with Vickers typically employed in testing metals while Knoop generally tests brittleness.
The diamond in these tests will represent the hardest material and therefore has the maximum value for all scales. The Mohs scale is used in most cases.
The microtopography and smoothness of an abraded surface and the related efficiency of the abrasion can be linked to the abrasive grain used and its particle size distribution (PSD).
Finer abrasive grains generally scrape off materials much slower, resulting in a smoother abraded surface. Specific applications require certain PSDs of abrasive grains in line with the desired production speed and required smoothness.
The accurate measurement of PSD is, therefore, a critical factor in abrasive grain quality inspection.
Table 1. Mohs hardness scale and observations on the hardness of some additional materials. Source: Bettersize Instruments Ltd.
| Mineral |
Mohs
hardness |
Other
materials |
Observations on the minerals |
| Talc |
1 |
|
very easily scratched by the fingernail; has a greasy feel |
| Gypsum |
2 |
~2.2 fingernail |
can be scratched by the fingernail |
| Calcite |
3 |
~3.2 copper penny |
very easily scratched with a knife and just scratched with a copper coin |
| Fluorite |
4 |
|
very easily scratched with a knife but not as easily as calcite |
| Apatite |
5 |
~5.1 pocketknife
~5.5 glass plate |
scratched with a knife with difficulty |
| Orthoclase |
6 |
~6.5 steel needle |
cannot be scratched with a knife, but scratches glass with difficulty |
| Quartz |
7 |
~7.0 streak plate |
scratches glass easily |
| Topaz |
8 |
|
scratches glass very easily |
| Corundum |
9 |
|
cuts glass |
| Diamond |
10 |
|
used as a glass cutter |
Measuring Particle Size Distribution of Silicon Carbide Abrasive Grains
Four different batches of black silica carbide (SiC) abrasive grain products were collected as sample materials for this experiment. These products are typically used in the production of bonded abrasives.
Batch A1 and Batch A2 were created using identical processing parameters to ensure that their grit number matched (ISO/FEPA F1500). This is also the case for Batch B1 and Batch B2 (ISO/FEPA F320).
The Bettersizer ST laser diffraction particle size analyzer is an ideal solution for the measurement of abrasive grain size distributions. Its patented dual lens optical systems (DLOS) enables the Bettersizer ST to provide efficient, accurate measurement results for particles ranging from 0.1 to 1000 microns (μm) in size.
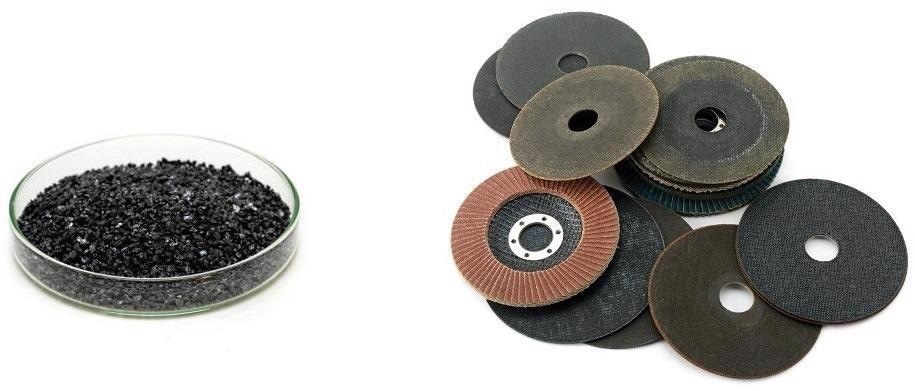
Figure 1. (left) loose black silicon carbide abrasive grits; (right) bonded abrasive products. Image Credit: Bettersize Instruments Ltd.
Comparing PSD Modes of Different Silicon Carbide Abrasive Grains
Figure 2 and Figure 3 show the PSD results of the abrasive grain samples acquired via the Bettersizer ST. It is clear from these results that the samples exhibit a very similar particle size distribution, but some differences are evident at the coarser end (>10 microns) for Batch A1 and Batch A2.
Abrasive grains which are larger than anticipated or specified will adversely affect the abrasion process.
Samples in Batch A and Batch B were found to exhibit similar particle size distributions, suggesting a robust and stable process was employed in these abrasive grains’ production.
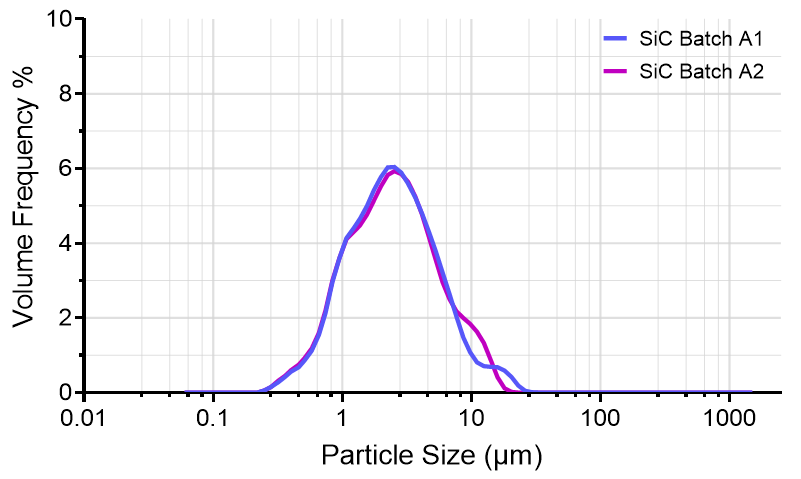
Figure 2. PSD curve of Batch A1 and A2. Image Credit: Bettersize Instruments Ltd.
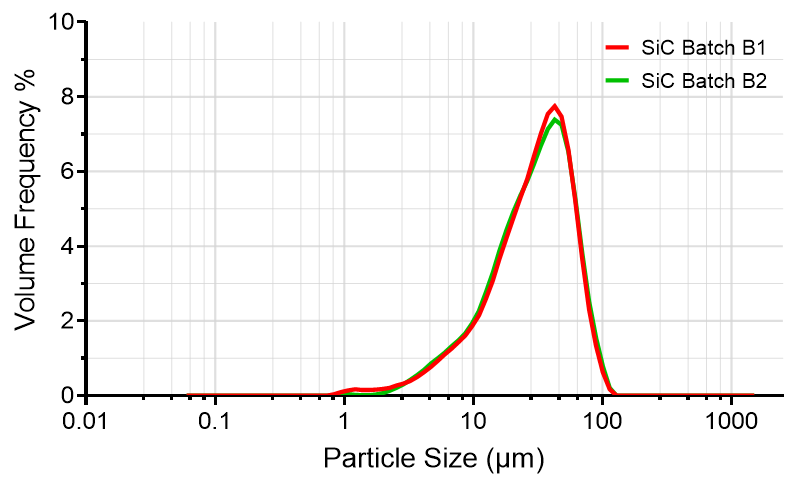
Figure 3. PSD curve of Batch B1 and B2. Image Credit: Bettersize Instruments Ltd.
PSD Results Help to Inspect Product Quality
The international standards organization (ISO) standard 8486-2: 2007 states that optimal abrasive grain size distribution is determined by three key criteria.
These criteria define three percentile size values of the abrasive grains size distributions:
- Criteria (a) has a maximum value of ds3 (D97 value from Bettersizer ST)
- Criteria (b) has a permitted range of ds50 (D50 value from Bettersizer ST)
- Criteria (c) states a permitted minimum value of ds80 or ds94 (D20 and D06 values from Bettersizer ST, respectively)
To pass and be considered within specification, a product must meet all three criteria in line with the ISO recommendations.
Table 2. Typical size values of Batch A1 and Batch A2 (ISO/FEPA F1500). Source: Bettersize Instruments Ltd.
Sample
Name |
Batch A1 |
Batch A2 |
ISO criteria
(permissible deviations) |
| ds3 (μm) |
11.7 |
10.85 |
Maximum 5 (+ 1.0) |
| ds50 (μm) |
2.256 |
2.294 |
2.0 (± 0.4) |
| ds80 (μm) |
1.122 |
1.108 |
Minimum 0.8 (- 0.3) |
Table 2 summarizes the ISO standard criteria and size values from PSD measurement results for Batch A.
The results confirm that Batch A1 and Batch A2 failed to meet criteria (a) of ds3, meaning that they do not adhere to the ISO standard on the coarser end. In practical terms, this translates to there being too many oversize particles in those samples.
Batch A1 and Batch A2 do meet the criteria (b) of ds50 and (c) of ds80, however, suggesting that particles in Batch A1 and Batch A2 adhere to the ISO standard on the finer end.
Table 3 displays the ISO criteria and typical size values from Bettersizer ST for Batch B1 and Batch B2 (ISO/FEPA F320). The results from the particle size distribution highlight that they failed to meet both criteria (a) and (c), confirming that both Batch B1 and Batch B2 failed on both the coarse and fine ends.
Table 3. Typical size values of Batch B1 and Batch B2. Source: Bettersize Instruments Ltd.
Sample
Name |
Batch B1 |
Batch B2 |
ISO criteria
(permissible deviations) |
| ds3 (μm) |
75.34 |
77.13 |
Maximum 49 (+ 1.5) |
| ds50 (μm) |
29.36 |
29.09 |
29.2 (± 1.5) |
| ds94 (μm) |
5.281 |
6.270 |
Minimum 16.5 (- 0.8) |
Conclusion
Particle size and size distributions of abrasive grains have a substantial impact on the abraded surface’s microtopography and smoothness.
Abrasive grains are key to the production of bonded abrasive products, and the ISO has developed a standardized approach to evaluate these abrasive grains via measurements of grain size distributions and highlighting any of the oversized particles.
The Bettersizer ST represents an efficient and reliable means of determining particle sizing information – a critical consideration in maintaining and improving quality control processes in a range of abrasive industries.
This process and these considerations remain essential to the manufacturing of abrasive grains, bonded abrasive products, loose grits used in polishing and general industrial applications.
References
- ISO 8486-2: 2007 Bonded abrasives - Determination and designation of grain size distribution - Part 2: Microgrits F230 to F2000
Acknowledgments
Produced from materials originally authored by Weichen Gan from Bettersize Instruments Ltd.

This information has been sourced, reviewed and adapted from materials provided by Bettersize Instruments Ltd.
For more information on this source, please visit Bettersize Instruments Ltd.