Extracts from plant materials that capture the plant's flavor and scent are known as essential oils and they have many uses.
Mass Spectrometry (MS) and Gas Chromatography (GC) and are excellent tools for the analysis of essential oils because the semi-volatile and volatile analytes that make up essential oils are readily separated, identified and quantified.
This can be helpful to obtain detailed chemical information on essential oils for a variety of quality control objectives, including process optimization, authentication and characterization.
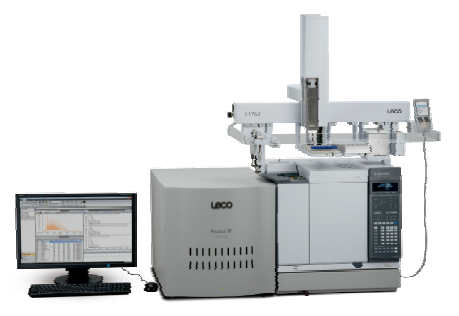
When using the Pegasus® BT for GC-MS, it is possible to use chromatography to achieve the separation of individual chemicals and also to deconvolute the full m/z range data in instances of chromatographic coelution.
Many chromatographic coelutions can be unraveled in less time, meaning that more information is obtained by adding mathematical separation to chromatographic coelutions. Tentative identifications are made using GC-MS from both chromatographic retention order information and spectral information.
Spectral verification can be done by matching the acquired full m/z range TOFMS data with NIST library databases. For added confidence, it is possible to link the retention times of observed peaks to the retention index by using a known alkane standard allowing for retention index matching with the NIST library databases.
This article analyzes and characterizes a mint essential oil showing the benefits of full m/z range data, deconvolution and retention index determinations.

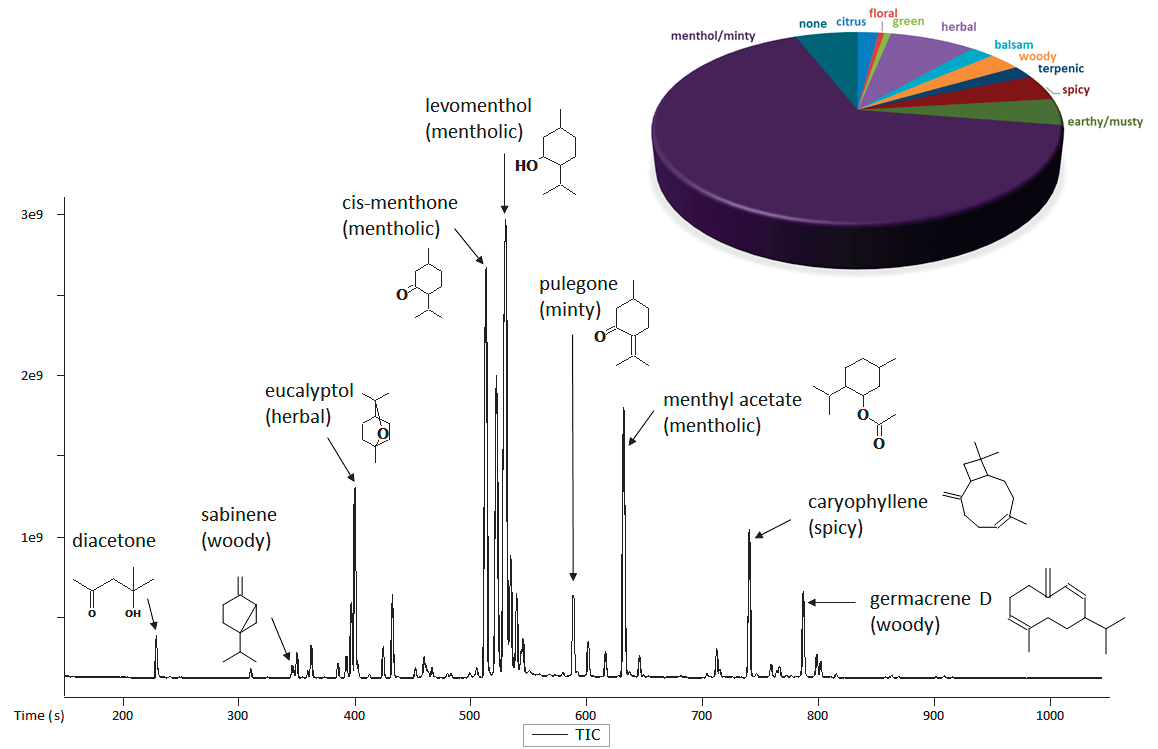
Figure 1. TIC Chromatogram for mint essential oil. Representative analytes of interest are shown along with a summary of the sample's aroma characteristics. Image Credit: LECO Corporation
Experimental
A mint essential oil was analyzed with GC-TOFMS after being diluted to 1% in acetone (shown in Table 1). The same methods for Retention Index (RI) determinations were also used to collect data for an alkane standard (C6 through C24).
Table 1. GC-TOFMS (Pegasus BT) Conditions. Source: LECO Corporation
| Gas Chromatograph |
Agilent 7890 with LECO L-PAL 3 Autosampler |
| Injection |
1 μL, split 100:1 |
| Inlet |
250 °C |
| Carrier Gas |
He @ 1.4 mL/min |
| Column |
Rxi-5ms, 30 m x 0.25 mm i.d. x 0.25 μm coating (Restek) |
| Temperature Program |
40 °C ramp 10 °C/min to 280 °C |
| Transfer Line |
300 °C |
| Mass Spectrometer |
LECO Pegasus BT |
| Ion Source Temperature |
250 °C |
| Mass Range |
33-500 m/z |
| Acquisition Rate |
10 spectra/s |
Results and Discussion
Figure 1 shows the representative GC-MS chromatogram for a mint essential oil. Information on the detected peaks within the sample was provided using LECO's automated data processing software. Table 2 shows the area % quantification, aroma properties and identifications for the 30 most intense analytes in the sample.
Table 2. Identification Information for Top 30 Analytes. Source: LECO Corporation
| |
Name |
R.T. (s) |
Formula |
Sim |
RI |
Lib RI |
CAS |
Odor Type |
Area % |
| 1 |
diacetone |
228.7 |
C6H12O2 |
936 |
839.8 |
838 |
123-42-2 |
|
1.102 |
| 2 |
sabinene |
346.2 |
C10H16 |
947 |
976.5 |
974 |
3387-41-5 |
woody |
0.326 |
| 3 |
β-pinene |
350.3 |
C10H16 |
939 |
981 |
979 |
127-91-3 |
herbal |
0.656 |
| 4 |
3-octanol |
362.7 |
C8H18O |
944 |
994.6 |
994 |
589-98-0 |
earthy |
0.835 |
| 5 |
α-terpinene |
385.7 |
C10H16 |
902 |
1019.7 |
1017 |
99-86-5 |
woody |
0.38 |
| 6 |
p-cymene |
392.9 |
C10H14 |
925 |
1027.6 |
1025 |
99-87-6 |
terpenic |
0.494 |
| 7 |
limonene |
397.0 |
C10H16 |
938 |
1032.1 |
1030 |
138-86-3 |
citrus |
1.978 |
| 8 |
eucalyptol |
400.1 |
C10H18O |
924 |
1035.4 |
1032 |
470-82-6 |
herbal |
5.836 |
| 9 |
γ-terpinene |
424.6 |
C10H16 |
909 |
1062.1 |
1060 |
99-85-4 |
terpenic |
0.81 |
| 10 |
(Z)-sabinene
hydrate |
432.6 |
C10H18O |
895 |
1070.7 |
1070 |
15537-55-0 |
balsam |
2.248 |
| 11 |
linalool |
459.9 |
C10H18O |
883 |
1100.4 |
1099 |
78-70-6 |
floral |
0.538 |
| 12 |
cis-menthone |
513.4 |
C10H18O |
946 |
1160.4 |
1164 |
491-07-6 |
mentholic |
16.828 |
| 13 |
menthofuran |
521.7 |
C10H14O |
893 |
1169.6 |
1165 |
494-90-6 |
musty |
3.12 |
| 14 |
(±)-menthol |
522.4 |
C10H20O |
781 |
1170.4 |
1169 |
1490-04-6 |
mentholic |
2.842 |
| 15 |
l-menthone |
523.1 |
C10H18O |
857 |
1171.3 |
|
14073-97-3 |
minty |
3.258 |
| 16 |
levomenthol |
530.6 |
C10H20O |
923 |
1179.7 |
1175 |
2216-51-5 |
mentholic |
29.868 |
| 17 |
(-)-terpinen-4-ol |
534.8 |
C10H18O |
883 |
1184.3 |
1185 |
20126-76-5 |
|
3.113 |
| 18 |
neoisomenthol |
539.9 |
C10H20O |
939 |
1190 |
1188 |
491-02-1 |
mentholic |
2.075 |
| 19 |
(1S,2R,5R)-(+)-
isomenthol |
543.9 |
C10H20O |
886 |
1194.5 |
|
23283-97-8 |
musty |
0.503 |
| 20 |
α-terpineol |
545.4 |
C10H18O |
911 |
1196.2 |
1189 |
98-55-5 |
terpenic |
0.848 |
| 21 |
pulegone |
588.7 |
C10H16O |
916 |
1247.4 |
1237 |
89-82-7 |
minty |
2.196 |
| 22 |
p-menth-1-en-3-one |
601.4 |
C10H16O |
902 |
1262.4 |
1253 |
89-81-6 |
herbal |
0.944 |
| 23 |
neomenthyl acetate |
616.4 |
C12H22O2 |
909 |
1280.3 |
1274 |
2230-87-7 |
|
0.661 |
| 24 |
menthyl acetate |
632.1 |
C12H22O2 |
937 |
1298.8 |
1295 |
89-48-5 |
mentholic |
9.468 |
| 25 |
isomenthyl acetate |
645.8 |
C12H22O2 |
935 |
1315.7 |
1305 |
20777-45-1 |
|
0.599 |
| 26 |
(-)-β-bourbonene |
712.4 |
C15H24 |
922 |
1398 |
1384 |
5208-59-3 |
herbal |
0.716 |
| 27 |
caryophyllene |
740.6 |
C15H24 |
953 |
1434.9 |
1419 |
87-44-5 |
spicy |
4.379 |
| 28 |
germacrene D |
787.0 |
C15H24 |
922 |
1496 |
1481 |
23986-74-5 |
woody |
2.316 |
| 29 |
β-cyclogermacrane |
798.7 |
C15H24 |
899 |
1512 |
1495 |
24703-35-3 |
green |
0.632 |
| 30 |
β-himachalene |
801.9 |
C15H24 |
928 |
1516.6 |
1500 |
1461-03-6 |
|
0.432 |
Determinations regarding analyte identification were made by searching the observed mass spectral information against the NIST 2017 MS library database with similarity (Sim) scores (shown in Table 2).
Retention Index values were calculated for all peaks detected to add confidence to the identifications. The determinations were made by acquiring data for an alkane standard. Table 2 also shows that the Library RI information in the NIST database was used to verify the observed RI value.

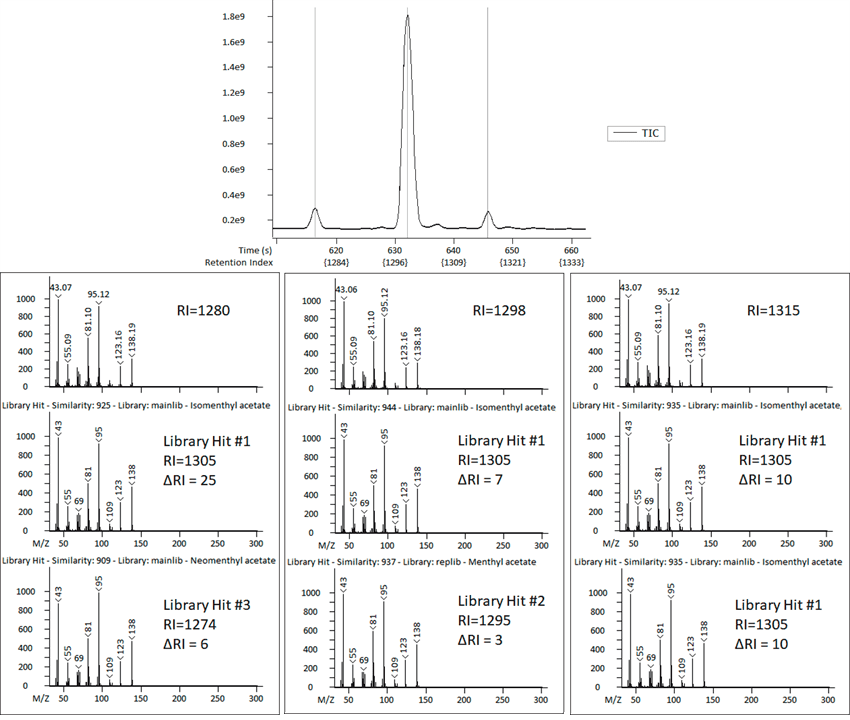
Figure 2. Retention Index can help add confidence to identifications for analytes with very similar spectral information. Image Credit: LECO Corporation
Figure 2 shows the way Retention Index was used to sort out some ambiguous peak identifications. After preliminary library searching, peaks #23-25 in Table 2 all matched to the same library spectrum, isomenthyl acetate.
The top spectra in Figure 2 show that the observed spectra for each of these three peaks are nearly identical, which is most often an indication of analytes or isomers with very similar chemical structures.
For this example, the retention index provided additional information related to the expected elution order that was used to clarify these isomers, with tentative identifications updated to isomenthyl acetate, menthyl acetate and neomenthyl acetate.

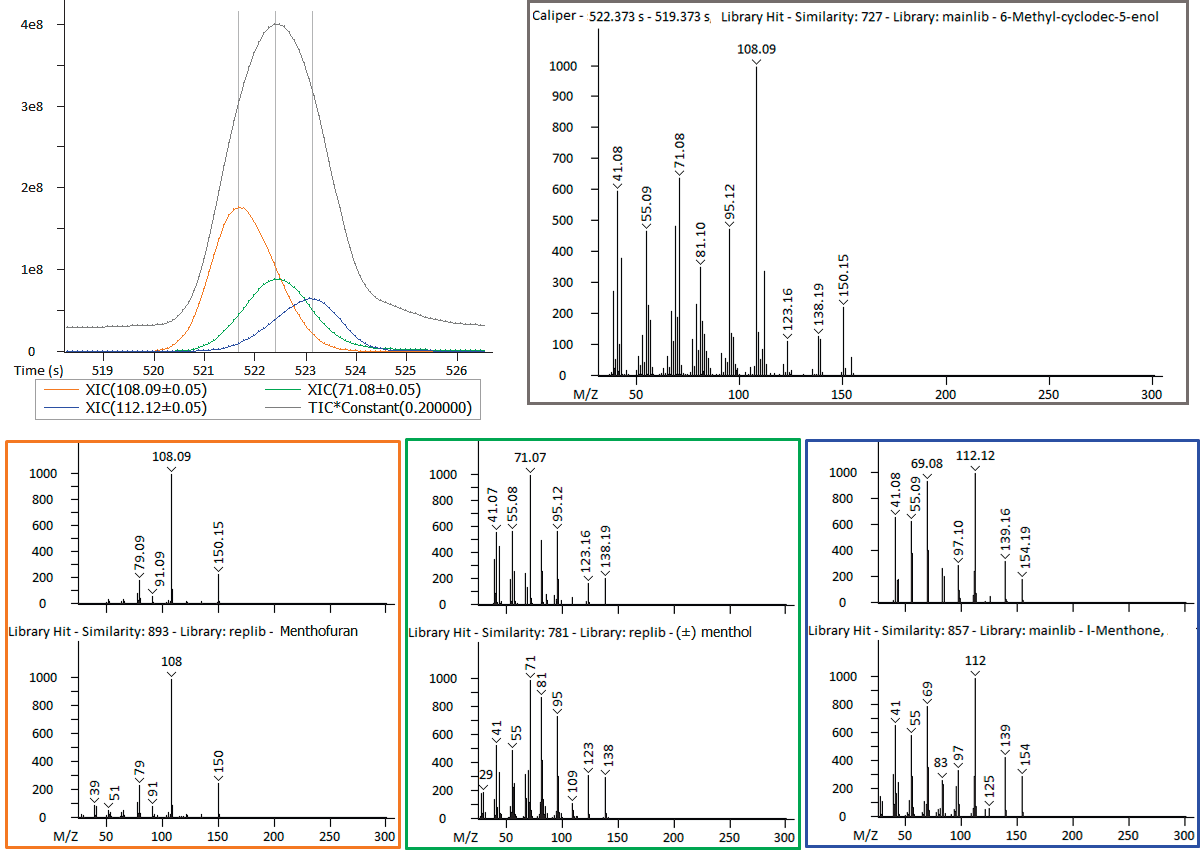
Figure 3. Deconvolution provides information on analytes that chromatographically coelute. Image Credit: LECO Corporation
The software’s data processing tools additionally offered the benefit of deconvolution, which is helpful in instances of chromatographic coelution. Within the data, there were some observations of instances of coelution. For example, Figure 3 shows peaks #13-15 in Table 2.
While it may appear that there is a single peak in the TIC view, plotting XICs specific to each analyte revealed that three separate analytes are coeluting.
Identifications (supported by Retention Index) of menthone, menthol and menthofuran were made through deconvolution, which provided clean spectral information for each coeluting analyte.
The upper right hand corner of Figure 3 shows the raw spectral information at the TIC apex, which is the combination of the coeluting analytes and is what would be available without deconvolution.
This spectrum matches 6-methyl-cyclodec-5- enol, which is a different analyte, that has a similarity score of 727; this indicates that the three coeluting analyte would be obscured without deconvolution.
Menthone, menthol and menthofuran have minty, mentholic and musty odor characteristics and are likely to be important contributors to the overall aroma profile. Therefore, without deconvolution, these analytes would have been difficult to detect.
The odor types listed in Table 2 were used to determine the associated aroma properties per analyte with analyte identifications. These aroma properties and the associated peak areas per analyte were then used to compile the overall sample characterization.
Directly connecting an analyte peak area to sensory detection requires the sensory threshold for that particular analyte as well as the response factor for that analyte on the instrument.
Without having these values, a chemical profile for the aroma characterizations can be provided by the peak areas.
ChromaTOF brand software was used to determine the peak areas by integrating the deconvoluted TIC peaks (the sum of all spectral peaks in the deconvoluted peak true spectrum integrated over the concentration profile for the chromatographic peak), and the Area % per analyte is reported in Table 2.
The pie chart in Figure 1 shows the top 30 analytes included in Table 2, which compiled peak area % by aroma type. As expected, mentholic or minty is the major aroma descriptor for this essential oil.
Conclusion
This work demonstrated the characterization of a mint essential oil through the application of GC-MS. For this sample, the individual analytes and the overall characterization based on aroma types were reported.
Deconvolution was crucial for distinguishing chromatographically coeluting analytes and retention index information was helpful for clarifying ambiguous analyte identifications.
Characterization information on the essential oil was provided by this detailed chemical information. GC-MS is a powerful tool for this type of analysis and can provide more information about a sample in less time.

Image Credit: LECO Corporation

This information has been sourced, reviewed and adapted from materials provided by LECO Corporation.
For more information on this source, please visit LECO Corporation.