For many years, in-situ observations of dynamic processes in the electron microscope have been performed. This process began just shortly after the first electron microscopes were invented.
Over the past few decades, the instrumentation available to record such dynamic processes has undergone a dramatic improvement, to the extent that it is now routine to capture videos at frame rates significantly faster than the human eye can process.
Gatan’s latest camera for such in-situ transmission electron microscopy (TEM) takes this further. Not only does such technology facilitate this trend of increased speed, but it also allows for high-speed data capture to take place with as few electrons as possible by means of direct detection, real-time electron counting.
This article outlines low-dose observations of beam-induced dendritic growth. The electron beam reduces Cu metal dendrites’ growth as a metal-organic precursor. Two different experiments were performed.
The first of these required the use of the camera to capture rapid dynamics at 75 frames per second (fps). The second experiment required the same camera to be used but to capture much slower growth at a lower dose and frame rates.
Here, the analysis of growth rates from the first dataset is presented, suggesting the further possibilities enabled by the recent introduction of integrated Python scripting into the Gatan Microscopy Suite® (GMS) software.
High-Speed Observation
The goal of the first experiment presented in this article was to capture dynamics at high speed with minimum electron dose. The magnification, dose rates at both sample and camera, and the frame rate need to be correctly set in order to obtain this result.
It is important that the TEM magnification is set as low as possible without losing the key features, given that low magnification allows the dose rate per camera pixel to be high, relative to the number of electrons per square angstrom of the sample.
This condition has two simultaneous effects. First, it minimizes electron beam effects on the sample, and second, it maximizes the signal-to-noise ratio for any given dose rate.
The camera framerate needs to be high in order to capture dynamics at high speed; however, there is an inevitable trade-off to be made here – as the framerate increases, to maintain a minimum number of electrons per camera frame, a higher dose rate is needed.
Therefore, the camera framerate needs to be set to the lowest framerate that still has the capacity to capture the dynamic event of interest.
The use of the LookBack™ feature of the K3™ IS camera allowed data from the exact onset of dendrite growth to be captured. This feature both enables the saving of data to disk even after observation of the initial dendrite growth and allows for data capture through the completion of the reaction.
As depicted by Figure 1, there are 10 frames from a 1-second long video acquisition of dendrite growth where data was collected at 75 fps. See below Figure 1 for the corresponding video of the data set.
To set the optimal conditions for this experiment, a frame rate of 75 fps was chosen with a full 5760 x 4092 pix field of view - despite the fact the K3 IS can acquire data at frame rates in excess of 3500 fps. The dose rate was set at the sample (of 270 e-/Å2/s), and the magnification was set to provide 0.63 Å pixels.
This condition leads to a very low dose rate at the camera of 3.6 e-/Å2/frame (e.g., 1.4 e-/pix/frame). The images were binned x2 in order to increase the signal-to-noise ratio at the expense of a small decrease in the spatial resolution for data visualization and analysis.
Regarding the binned images, the dose rate per binned pixel was 5.7 e-/pix/frame. This results in a signal-to-noise ratio for a single binned pixel of 2.3, given the Poisson statistics of the electron beam itself.
The real-time electron counting algorithm of the K3 IS enables the accurate detection of the faint signal in the final image, despite the very low signal-to-noise ratio of the incoming electron beam.
A clear video begins to emerge by performing an exponentially weighted running average on the data to combine the signal from several frames. An important point is thus illuminated from these calculations regarding low-dose TEM. At low dose rates, 75 fps is close to the maximum useful framerate from which full resolution information can be extracted from every frame.
It must be noted that even a perfect detector, which was able to determine the exact position of every electron striking it, would be restricted by the incoming signal-to-noise of the electron beam itself during the increase of the framerate.
Both a direct detection sensor and a real-time counting algorithm are employed by the K3 IS to provide closer and more accurate results than ever before.
Sources of blurring and signal attenuation present in scintillator-based cameras are eliminated by the direct detection sensor. Meanwhile, the real-time counting algorithm can significantly limit the effects of noise sources within the camera, allowing the shot noise from the electron beam itself to become the primary noise component.
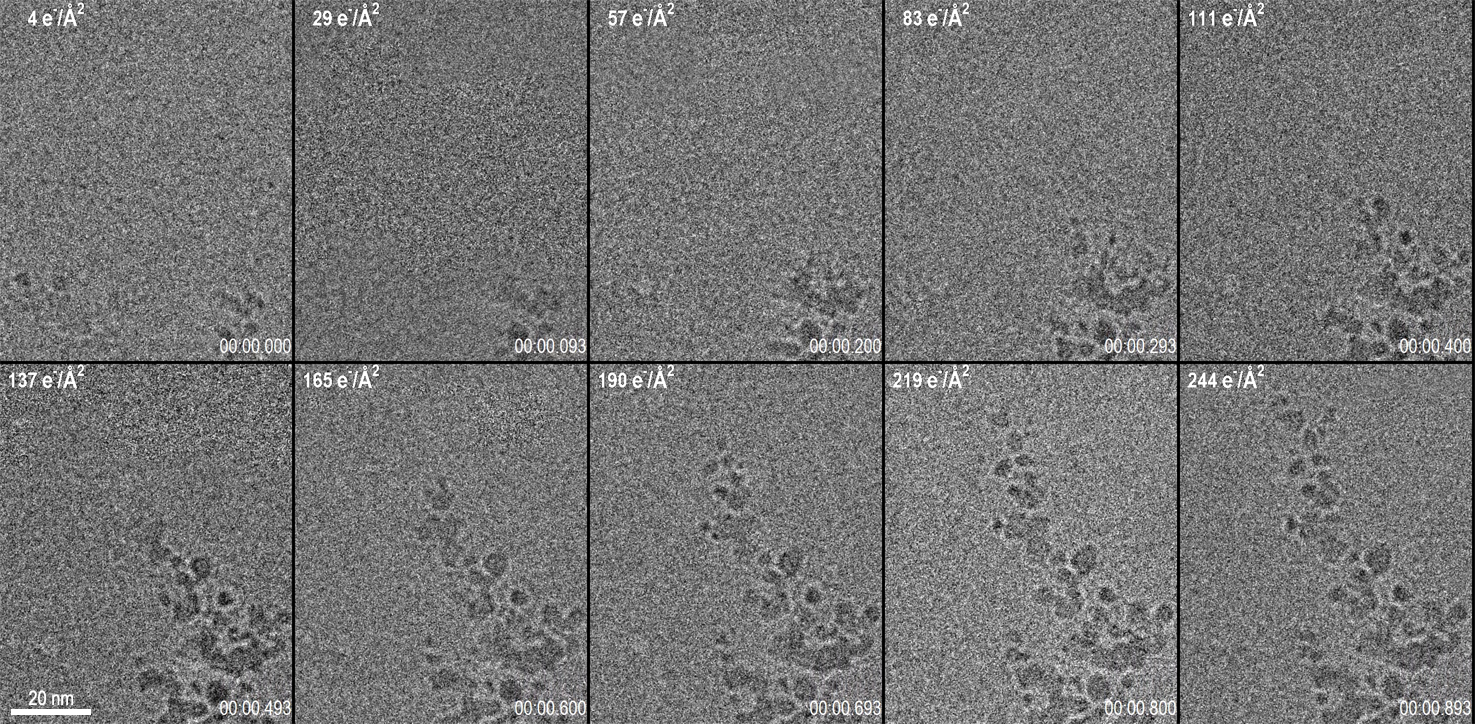
Figure 1. 10 Frames from a 1 s long video acquisition of dendrite growth. Data was collected at 75 fps. After drift correction, 5 frames were averaged using an exponentially weighted moving average to produce the images shown here. The cumulative dose is given in the top left of each frame, while the time (m:s:ms) is given in the bottom right. The total dose for the entire video was only 270 e-/A2. The full video is below. Image Credit: Gatan Inc.
Counted Video of Fast Cu Dendrite Growth
Video Credit: Gatan Inc.
The K3 IS, unlike the K2® and K2 IS, brings the benefits of counting to in-situ video acquisition. The result, therefore, is that for the first time, low-dose videos like the ones seen here are made possible
There are, therefore, three basic parameters, as demonstrated by this result, which must be properly balanced to provide adequate signal-to-noise in the incident signal from the electron beam: namely temporal resolution, spatial resolution and electron dose rate (or flux).
So, either the spatial resolution must be reduced, or the electron dose rate must be increased to maintain a useful signal-to-noise while pushing the temporal resolution higher. A trade-off was made in this experiment between the spatial resolution and the dose rate, where the chosen condition collected data at 0.63 Å/pix and a dose rate of 270 e-/Å2/s.
Though the next dataset also further reduces the dose rate to just 1.0 e-/Å2/s, it has to do this with a slightly worse spatial resolution. However, this lower dose condition arguably demonstrates another strength of the K3 IS: its pixel resolution and large field of view.
Observing a Large Field of View
Data from a related counted in-situ data set is shown in Figure 2, which also captures the growth of a Cu dendrite. Once again, the growth is beam induced. In this experiment, a slower growth rate of 10 nm/s is observed because the beam dose rate is lowered to 1.0 e-/A2/s,
The frames in Figure 1, for comparison, were captured in just 1 s at 75 fps. The data in Figure 2 was captured over 8 minutes (a duration almost 500 times longer). The dose rate, as a consequence of the longer experiment duration, is two orders of magnitude higher in Figure 1 than Figure 2, and Figure 2 is three orders of magnitude lower than a single typical high-resolution TEM image.
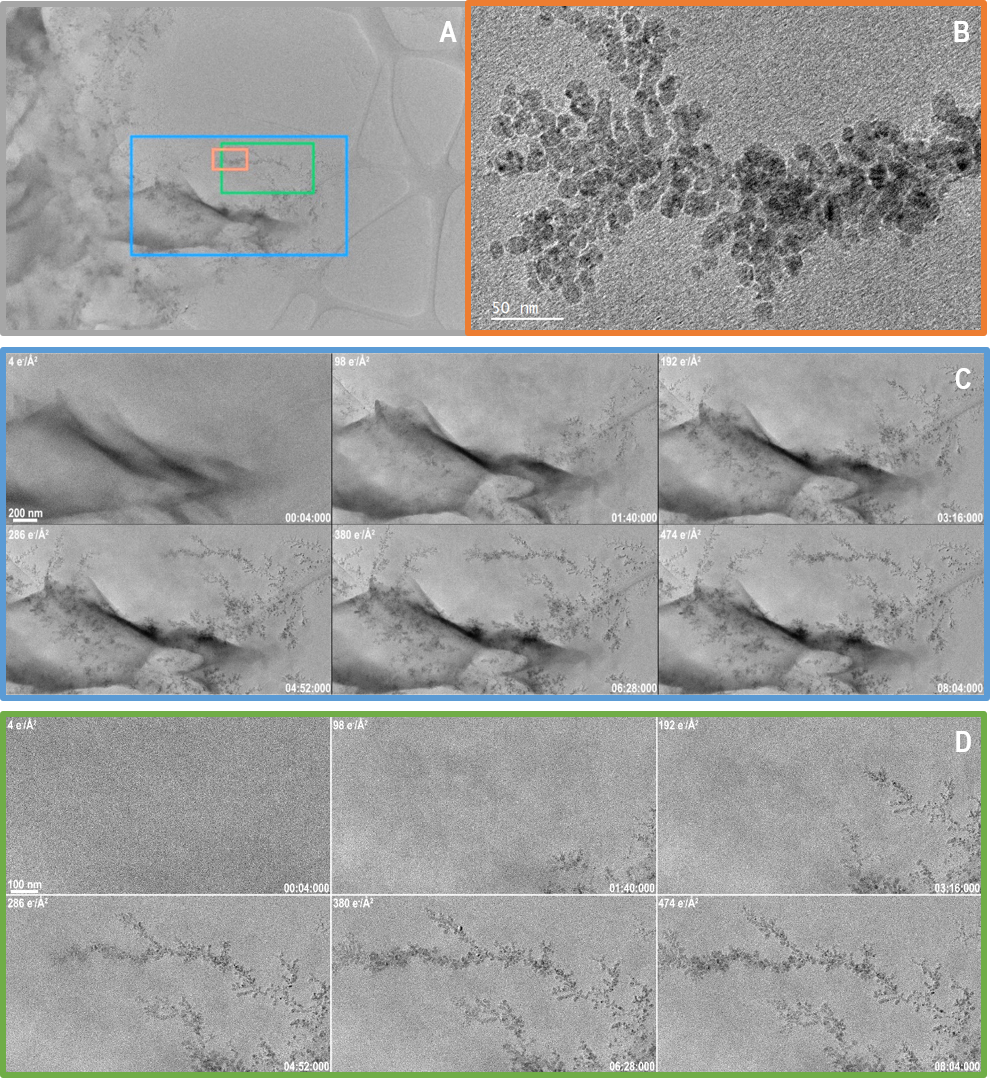
Figure 2. A) A still frame taken from near the end of the video showing the entire region which was captured throughout the video. Colored boxes indicate the regions that are displayed in more detail in B,C and D. B) A summed frame from near the end of the video showing the high resolution information that was captured. This frame is the result of summing 100 original frames after drift correction. C) 6 summed frames from a video acquired over 8 minutes of dendrite growth. Data was collected at 5 FPS. After drift correction, 10 frames were summed to produce the images shown. The cumulative dose is given in the top left of each frame, while the time (m:s:ms) is given in the bottom right. Total dose for entire video was only 474 e-/A2. D) A smaller region processed in the same way as in C but displayed at a higher magnification so more detail is visible. Full videos can be found below. Image Credit: Gatan Inc.
Counted Video of Slow Cu Dendrite Growth (Zoomed)
Video Credit: Gatan Inc.
Counted Video of Slow Cu Dendrite Growth
Video Credit: Gatan Inc.
The total dose throughout the experiment is 474 e-/A2, or barely 2x that in the first video: it is this dose that provides the electrons needed to grow the dendrites to this size.
The data shown in Figure 2, in addition to capturing data with a lower dose rate, captured a much greater field of view of 5720 x 4060 nm or about 5.7 x 4.1 µm. Though this area is vast, it is sampled with pixels that measure just 0.5 nm in width.
There is a significant value in acquiring over a large area but subsequently processing and analyzing data from the locations where growth does occur when it comes to experiments like this one, where it is never certain where dendrites grow.
Given that a large number of dendrites are simultaneously observed, it is also possible to produce better statistics on the dynamic process.
For this type of large field-of-view observation, the counting algorithm used by the K3 IS camera is ideal. The location of individual incoming electrons is determined to sub-pixel accuracy for each raw camera frame.
This super-resolution mode results in images with >94.2 million pixels where this large field of view can be continuously captured at up to 30 fps, despite the K3 IS having>23.5 million pixels.
With all things considered, including the experimental trade-offs between electron dose rate, spatial resolution and temporal resolution, the ideal conditions for this experiment were as follows:
- Frame rate of 5 fps
- Extremely low dose rate of 1.0 e-/A2/s
- Pixel size of 0.5 nm
A dose rate of 4.8 e-/pix/frame was yielded by this combination, slightly lower than in the high-speed data, wherein the dose rate per binned pixel per frame was 5.7.
Data Analysis
Drift correction, binning and an exponentially weighted moving average (over time, not space) were used to process the data presented in Figures 1 and 2. The next step, however, toward reaching a data-based scientific conclusion was to perform an analysis of dendrite growth rates.
Though there are a range of tools for processing and visualization on offer from the standard user interface in the GMS software, there are few tools for analysis.
GMS has always had scripting capabilities (typically called DM-scripts to supplement the user interface with additional flexibility and power). One of the key advantages of scripting within GMS is that the results of such scripted acquisition or processing can be visualized and manipulated using the standard user interface.
However, the scripting language therein has been GMS-specific. Though this has also limited the use of other open-source libraries within GMS during TEM data collection, it is also able to be uniquely tailored to the needs of microscopists.
Gatan has integrated Python scripting into the GMS, starting in GMS version 3.4.0, which added the potential to run and edit Python (v 3.7) code directly from the scripting interface.
As is displayed in Figure 3, two clear examples are shown using Python in GMS in order to analyze the dendrite growth data from Figure 1.
As displayed by the first example, the code obtains a one-dimensional profile (shown in 3A) from the image as a function of time. This information is then presented as a kymograph, shown in part F, where a clear boundary can be observed, with its slope representing the average growth rate.
As the data was played back, the profiles were measured live (it could also have been measured during data acquisition).
The second analysis example depicts how a more sophisticated image segmentation technique, implemented with thresholding and morphological image processing functions from the scikit-image Python package, is used to measure the same dendrite growth.
As the input data (Figure 3 A and C) was noisy, it was pre-processed within the same script. Figures 3D and 3E respectively show the final segmented result for selected frames, as well as a colored overlay on top of the filtered last frame.
Another function in the scikit-image package can therefore help easily obtain various measurements from the segmented frames. Figure 3F depicts two of the resulting measurements where both the area and length of the dendrite are plotted over time.
The entire process took <10 seconds or 0.4 seconds per million image pixels on a PC with an Intel Core i7 8850H at 2.6 GHz. Though it must be noted that this rate is far too slow to process all the data coming from the K3 IS camera in real-time, it would be possible to process a subset of the data live in this manner.
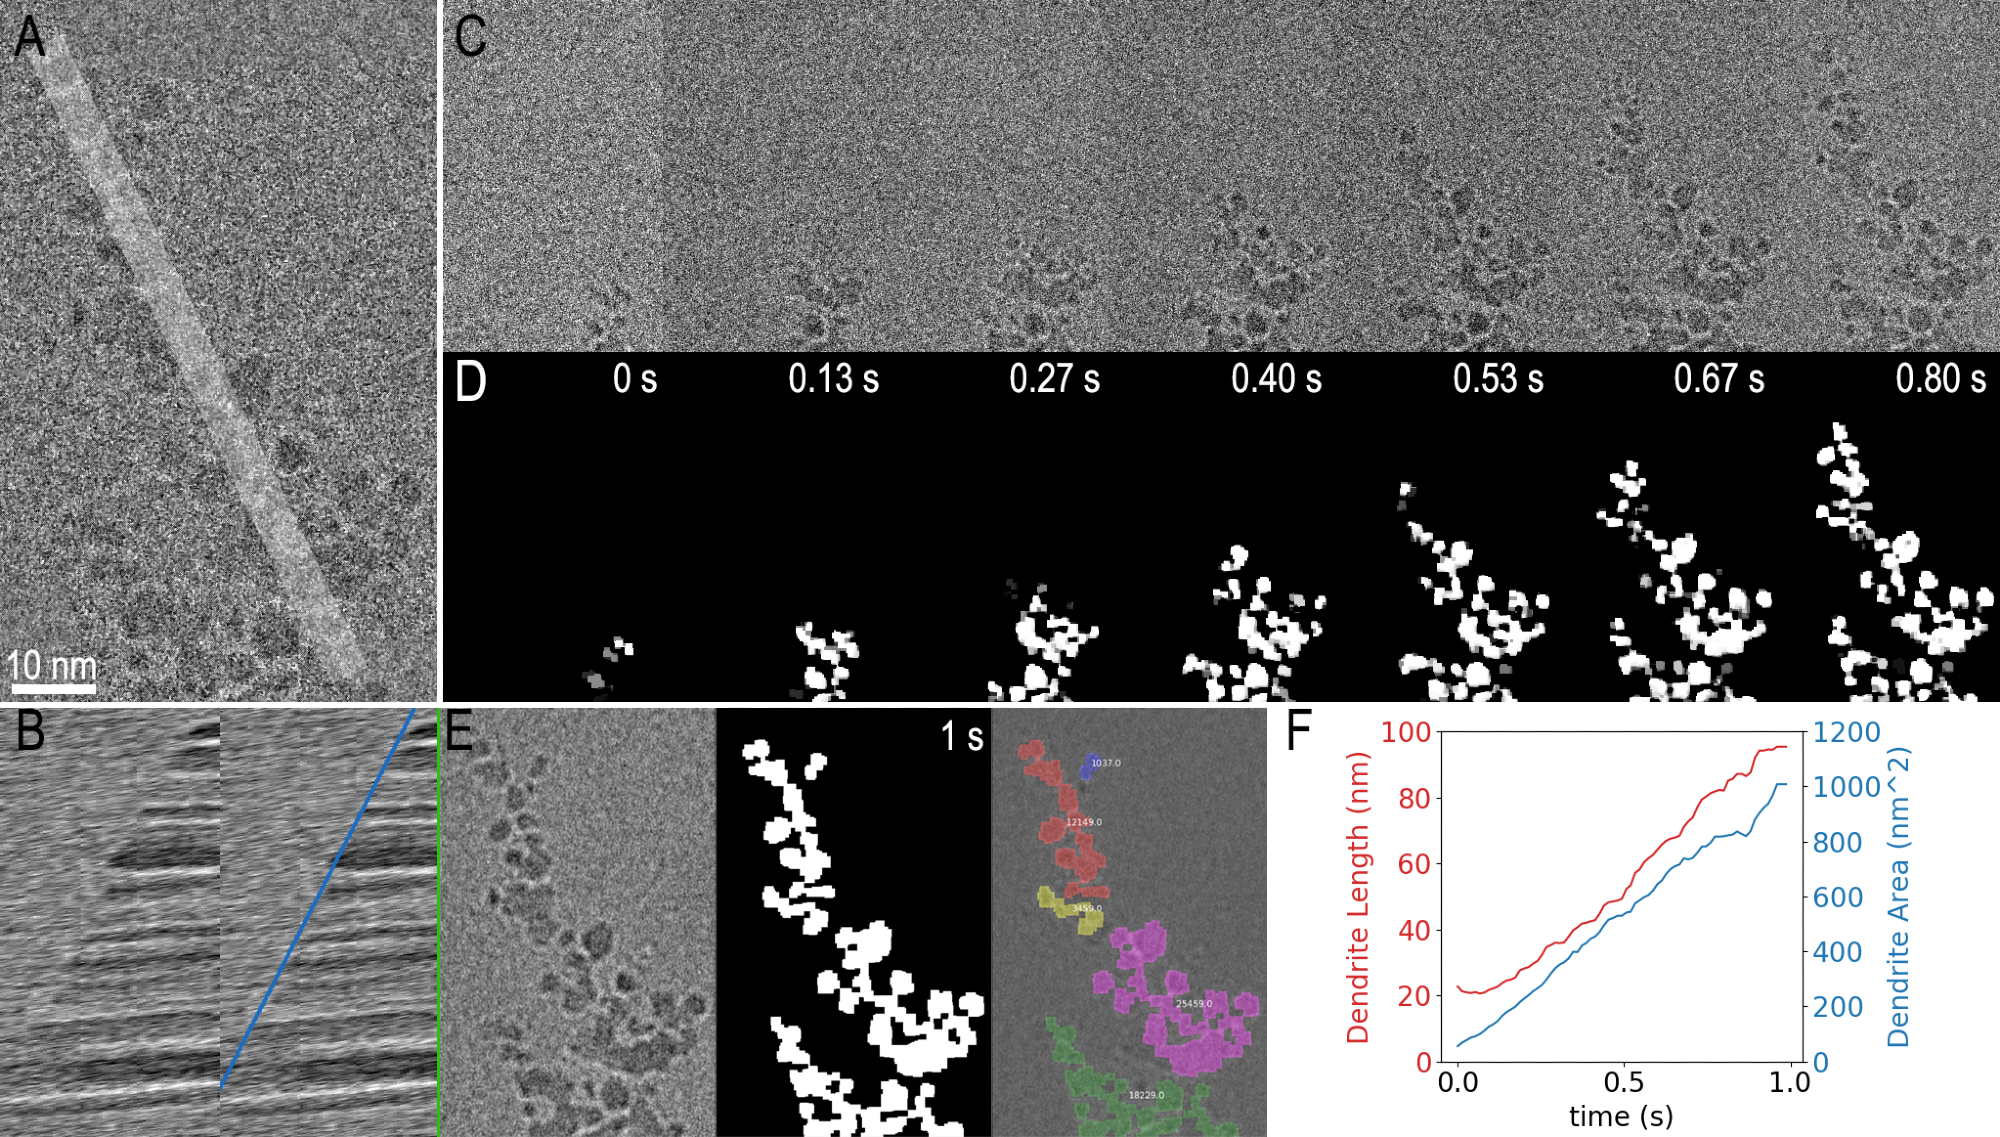
Figure 3. Processing and Analysis at the Microscope. Data from a 1s, video captured with K3 IS counting camera. Raw data from final frame is shown in A) along with the profile used to produce the kymograph in B), where the profile is sampled over time. The same kymograph with a blue line corresponding to the average linear growth rate and a vertical green line indicating which profile was calculated from the frame in A) A selection of the 75 raw frames, are shown in C), with the corresponding segmented images in D). The final (filtered) frame is shown in E, along with the corresponding segmented frame and a color overlay on the filtered frame of connected segmented areas. The final measured values for dendrite length and area as a function of time are given as a plot in F). Image Credit: Gatan Inc.
Conclusion
Two very different time scales were used to capture the beam-induced growth of Cu dendrites: both using the K3 IS in counted in-situ mode. The incoming signal reaching the camera was very weak in both of these cases.
At high speed, this can be attributed to trade-offs that are necessary to balance spatial resolution, framerate and electron dose rate.
The weak incoming signal at slow speeds was primarily due to the very low dose rate of just 1 e-/A2/s - three orders of magnitude less than that of a typical HRTEM image. These dose rates, whilst small, were still big enough to drive dendrite growth, though it must be acknowledged that the growth rate was much lower for the lower dose rate.
Analysis of this growth was facilitated by the integration of Python in GMS: in the future, real-time analysis can be performed on a subset of the raw data during acquisition.
Acknowledgments
This work was facilitated by the EPIC facility of Northwestern University’s NUANCE Center, which has received support from myriad programs, including the Soft and Hybrid Nanotechnology Experimental (SHyNE) Resource (NSF ECCS-1542205); the MRSEC program (NSF DMR-1720139) at the Materials Research Center; the International Institute for Nanotechnology (IIN); the Keck Foundation and the State of Illinois, through the IIN.
Kun He (NUANCE) provided the sample used in this work. Ben Miller (Gatan), Paul Smeets and Roberto dos Reis collected data (NUANCE).

This information has been sourced, reviewed and adapted from materials provided by Gatan Inc.
For more information on this source, please visit Gatan Inc.