A geological specimen can contain a vast amount of historical information about the region from which they are unearthed. This historical information usually predates the history of humanity and the planet Earth, as in meteorites.
Around 4.5 billion years ago, the solar nebula's accretion disc formed a series of rocky planets, meteors, and asteroids. Among the earliest solids to form were grains of corundum and minerals with calcium-aluminum inclusions (CAIs).
Analyses of these meteorites can generate invaluable information about the early solar system and should be thoroughly investigated.
Energy dispersive spectroscopy (EDS) in the scanning electron microscope (SEM) is a technique centrally embraced by analytical sciences to identify the elemental composition of a sample with microscopic spatial resolution.
The EDS method for geological analysis is ideally suited as it facilitates the determination of mineral distribution based on the energy distribution of the characteristic X-rays emitted from a sample.
However, the detection limit is usually ~0.1 wt%, implying that the technique is not sensitive to trace elements and is unable to display a number of characteristics of mineral formation and alteration. Consequently, cathodoluminescence (CL) is often employed to expose trace element chemistry.
CL spectroscopy analyzes a specimen and the light it emits from ultraviolet, visible and infrared wavelengths. Numerous trace elements (and crystal defects) generate light emissions at these wavelengths, such that spectroscopic analysis reveals their presence and distribution down to parts per million level (0.00001 wt%).
In spite of the clear complementary nature of the EDS and CL signals, their simultaneous detection is often excluded in electron microscopy due to incompatibilities with hardware.
Here a methodology for the simultaneous capture of EDS and CL spectroscopy data is presented as demonstrated on a chondritic meteorite unearthed in Antarctica – Miller region 090010 – containing CAIs, exposing grain boundaries in corundum and the distributions of trace elements Fe and Sm.
Methods
In this study, the specimen analyzed was a chondritic meteorite first discovered in Antarctica, which contained CAIs. The sample was prepared as a thin section, and the deposit of a 3.0 nm thick carbon coating was conducted, via the PECS™ II system, to prevent charging.
![Plane-polarized light photomicrograph of the thin section sample MIL 090010, after [4].](https://d12oja0ew7x0i8.cloudfront.net/images/Article_Images/ImageForArticle_21207_16432701305163511.png)
Figure 1. Plane-polarized light photomicrograph of the thin section sample MIL 090010, after [4]. Image Credit: Gatan Inc.
The Monarc® Pro system was used to capture CL spectra, and the EDS spectra were collected using an Octane Elite detector (EDAX) attached to an FE-SEM, as shown in Figure 2.
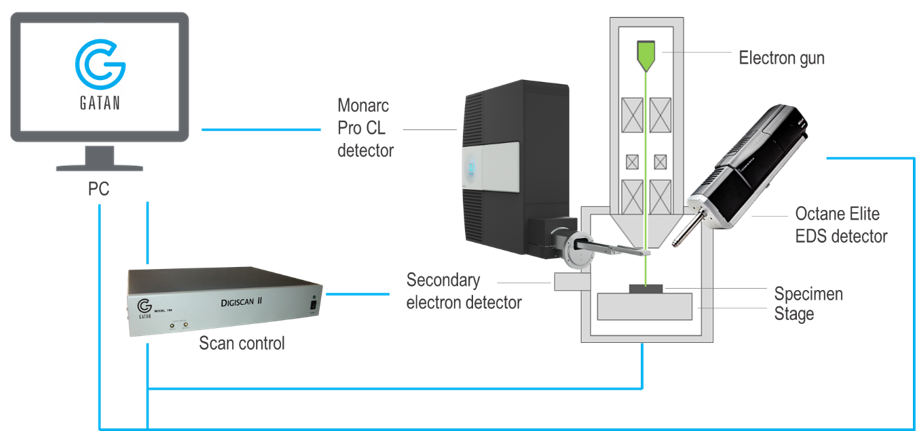
Figure 2. Schematic layout of the experiment. The Monarc CL detector and Octane Elite EDS detector are attached to an SEM. CL and EDS spectra are captured within DigitalMicrograph software with beam control by the DigiScan scan control system. Image Credit: Gatan Inc.
The CL and EDS techniques employ a working distance of around 10 mm beneath the SEM pole piece. However, due to the line of sight being obstructed, the collection mirror used in spectroscopic CL detectors stops emitted X-rays from reaching an EDS detector.
However, the "EDS collection mirror" option of the Monarc systems was employed, facilitating simultaneous and effective capture of CL and EDS signals possible. The EDS and CL signals were synchronously captured using DigitalMicrograph® software, enabling perfect pixel correlation between the EDS and CL maps.
Using an SEM, the specimen was scanned with an acceleration voltage of 10 kV across a 130 μm x 130 μm square region consisting of 375 x 375 pixels. The capture of the EDS data was conducted from 0 – 10 keV with 2048 channels each at a bandwidth of ~5 eV.
The CL spectroscopic data showed the emission as a function of wavelength in 670 wavelength segments from 367 – 783 nm (spectral resolution ~0.62 nm).
Results and Discussion
To identify the minerals being observed at the same spatial coordinates, the elemental quantification from EDS was combined with CL spectroscopy. In addition to Mg, Ca and Al, the EDS spectrum image identified other elements, some in great abundance, such as O and Si, and others in smaller amounts, including Fe, C, Ti and Na.
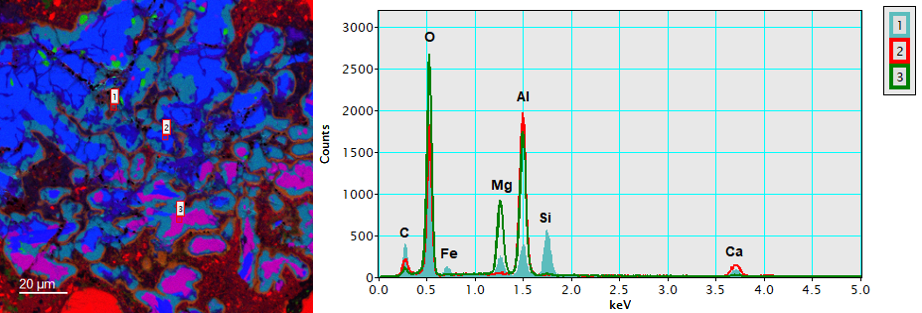
Figure 3. (left) Elemental quantity maps extracted from the EDS spectrum image corresponding to aluminum (blue), calcium (green), and magnesium (red); and (right) extracted EDS spectra from points 1 (aqua fill), 2 (red), and 3 (green). Image Credit: Gatan Inc.
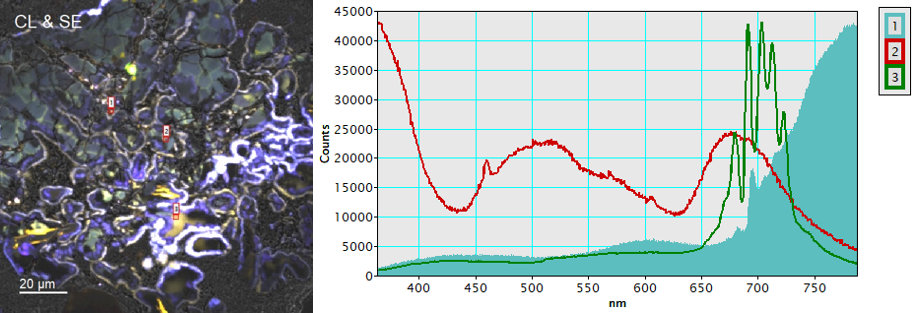
Figure 4. (left) True color representation of the CL spectrum image (color) overlaid with SE image (gray), and (right) extracted CL spectra from points 1 (aqua fill), 2 (red), and 3 (green). Points 1, 2, and 3 are the same locations as in Figure 3. Image Credit: Gatan Inc.
Simultaneously, the CL spectral data uncovered the presence of spinel (MgAl2O4) with Cr3+ characteristic peaks at 680, 691, 704, 713 and 723 nm (see spectrum 3 in Figure 4). The concentration of Cr3+ was too little for EDS to detect; however, the CL emission spectrum carries a considerable signature of Cr3+ in spinel.
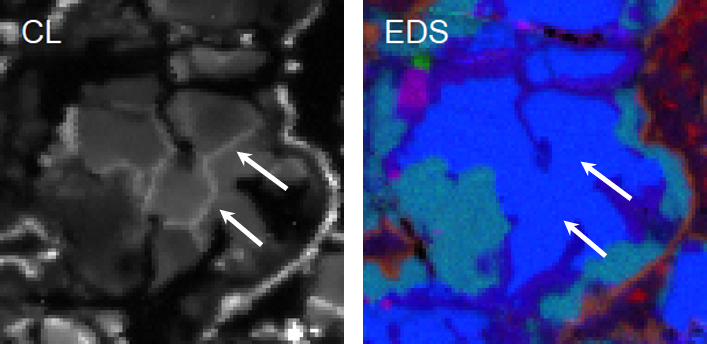
Figure 5. (left) Bandpass CL image displaying 580 ± 20 nm and (right) colorized EDS map for Al (blue), Ca (green), and Mg (red). Image Credit: Gatan Inc.
Furthermore, intra-material grain boundaries were seen in the corundum at 580 nm (see arrowed positions in Figure 5).
The size of the grains can generate sufficient information in relation to the conditions of crystal formation, such as the cooling rate and temperature.
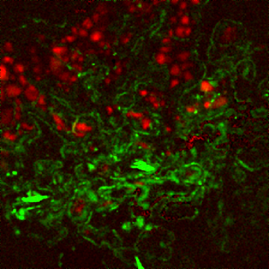
Figure 6. Extraction of CL trace elements (Fe in corundum) found at 460 nm (red) and (Sm in apatite) 605 nm (green). Image Credit: Gatan Inc.
CL emission peaks for trace elements were seen in the spectrum for corundum at 460 nm relative to Fe3+ and 603 nm in apatite corresponding to Sm3+.2,3 Trace element maps were produced by observing the differences between peak intensities at 460 nm and 603 nm against the enveloping spectral intensity (Figure 6).
Detecting these trace elements is one of the great advantages of the CL spectroscopy technique, as it facilitates the detection of elements beneath the EDS detection threshold.
Conclusions
Simultaneous capture of CL and EDS was successfully executed, facilitating perfect pixel correlation between the techniques. Elemental quantification was performed using EDS, while grain boundaries and trace elemental maps were determined using CL.
This simultaneous capture represents a significant advantage over the use of each technique in isolation. EDS and CL data perfectly complement one another to offer a better, complete sample analysis, including elemental quantification and trace element information.
References
- D. J. Stowe, J. D. Lee, and M. Bertilson, "Octane Elite and Monarc Come Together to Capture EDS and CL Simultaneously," EDAX Insight, pp. 1-2, September 2020.
- J Mogmued, et al., Journal of Physics: Conference Series 901 012075 (2017).
- C.M. MacRae, et al., Microscopy and Microanalysis 18, 1239-1245 (2012).
- NASA Curation | Antarctic Meteorites. "Thin Section Photo of Sample MIL 090010 in Plane-Polarized Light with 1.25X Magnification." 25 Apr 2021. https://curator.jsc.nasa.gov/antmet/samples/antmet_img.cfm?image=MIL0900...

This information has been sourced, reviewed and adapted from materials provided by Gatan, Inc.
For more information on this source, please visit Gatan, Inc.