Sponsored by Avantes BVNov 29 2022Reviewed by Emily Magee
About Indocyanine Green (ICG)
When conducting fluorescence imaging in various medical applications, practitioners typically use a powdered dye known as Indocyanine Green (ICG). ICG emits fluorescence between 750 and 950 nanometers (nm) with maximum values around 810 nm when exposed to water. In contrast to alternative fluorescence imaging dyes, ICG can facilitate imagining in the Near-Infrared (NIR) range from 780 nm to 2500 nm.
The NIR range enables comprehensive imaging capabilities that operate deeper in the tissue optical window. The tissue optical window sits in a range between 650 nm to 1350 nm, the range where light has a maximum depth to penetrate tissue. To prepare the solution for medical applications and injection, ICG powder is dissolved in sterile water.
The highly concentrated injection solutions are measured according to the application. Some of the uses for ICG are comprised of hepatic function studies (preparative tests for major liver surgery), ophthalmic angiograms (tests on blood vessels and other structures in the back of the eye), and lymphatic mapping (lymph nodes, lymphatic vessels, and lymphatic fluid).
For surgical applications, the ICG injection solution is coupled with an infrared laparoscope. The fluorescence light can pass through the laparoscope’s optical filter, which enables surgeons to work in two alternating infrared modes. The first IR mode can detect detailed structures under infrared light. The second IR mode displays pure fluorescence with the greatest contrast via a black-and-white image.
ICG is detectable in the human body as it absorbs infrared radiation from the light source and emits longer wavelengths of infrared radiation. For the experiment reported in this article, ICG concentrations were produced in the range of 2 to 50 micromolar: a micromolar is a concentration of one-millionth molecular weight per liter. The light can pass through the solution without fully absorbing it in these ranges.
If tests were performed with the surgical application concentrations, the deep, dark green color of the ICG would absorb the majority, if not all, of the light. Generally, the greater the concentration of a dye, the more fluorescence it will emit (like in Fluorescein). However, a highly concentrated solution of ICG will appear black, making it optical opaque and not viable for a fluorescence reading. To accommodate this, Dr. John Black, a chair for IEEE Engineering in Medicine and Biology Society, recommended a range of 2 to 50 micromolar.
Used System and Methodology
Description of the System
In this particular experiment, the AvaSpecHERO spectrometer was used. The AvaSpec-HERO has been developed around Avantes’ High-Sensitivity, Compact (HSC), 100 mm optical bench, which enables a NA of 0.13 and a cooled, back-thinned detector (1024 × 58 pixels).
The electronics of the system utilize the latest Avantes AS7010 board, which includes a high-performance Analog to Digital converter with exceptional signal-to-noise performance and the capability to allow high-speed communication via USB 3.0 and Ethernet.
Due to the instrument’s high sensitivity and excellent signal-to-noise, the HERO is the perfect tool for fluorescence measurements.
To excite the sample, a 785 nm Raman laser was employed. The laser was attached in line to a reflection probe. A long pass filter was installed on the reflection probe’s receiving end to obstruct the 785 nm laser and keep it hidden from the spectrometer (Figure 1). This step allows the user to observe only the fluorescence emission peak.
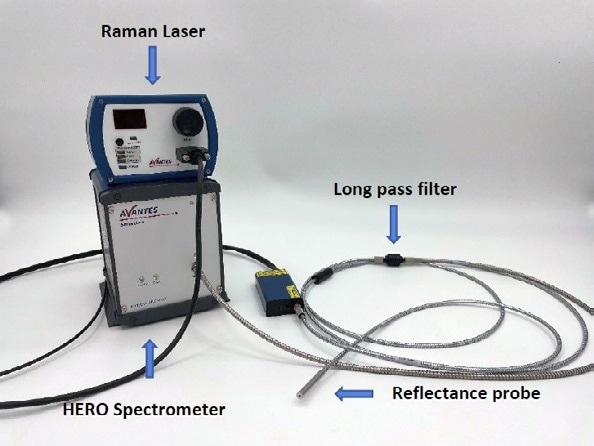
Figure 1. Setup of Fluorescent Test. Image Credit: Avantes BV
Description of Methodology
The first step of the experiment required establishing the appropriate solution concentrations. As previously described, the optimal range for testing the fluorescence of ICG was recommended to be 2 to 50 micromolar. In the early tests, surgical concentrations of 1.25 mg/mL, 5 mg/mL, and 20 mg/mL were used.
These concentrations corresponded to a variety of medical applications, respectively. The injection solution of 1.25 mg/mL is generally used for lymphatic mapping, the injection solution of 5 mg/mL is for hepatic function studies, and the injection solution of 20 mg/mL is used when conducting ophthalmic angiograms. After just a few tests using these concentrations, it became clear that the solutions were too dark in color to acquire appropriate fluorescence readings.
While these concentrations are typically used in surgical procedures with laparoscopic equipment and can offer proper readings, the higher concentrated solutions have a different host material in real-world applications. ICG responds in various ways depending on the respective host materials. In this experiment, distilled water was used as a solvent.
The micromolar values were converted to mg per mL to get the appropriate concentrations in the micromolar range. The nine groups were evenly split among the range and found the theoretical concentrations in mg/mL using dimensional analysis and Excel (Figure 2). To obtain the right theoretical concentrations, base concentrations were composed of the ICG and distilled water (Figure 3).
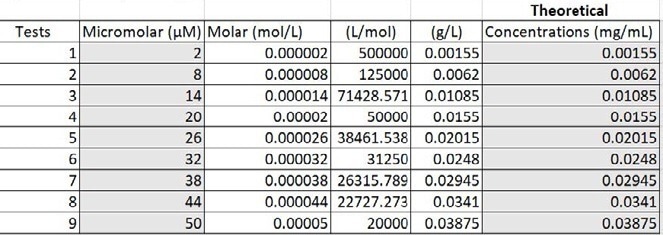
Figure 2. Converting micromolar to mg per mL. Image Credit: Avantes BV
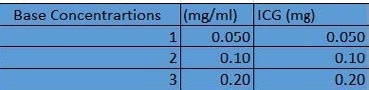
Figure 3. Base concentrations in distilled water. Image Credit: Avantes BV
The base concentrations were subsequently diluted with extra distilled water to ensure concentrations in the proper range were achieved (Figure 4). The values highlighted yellow used the first base concentration of 0.050 (mg/ mL), those highlighted light green used the second base concentration of 0.10 (mg/mL), and the dark green values used the third base concentration of 0.20 (mg/mL).
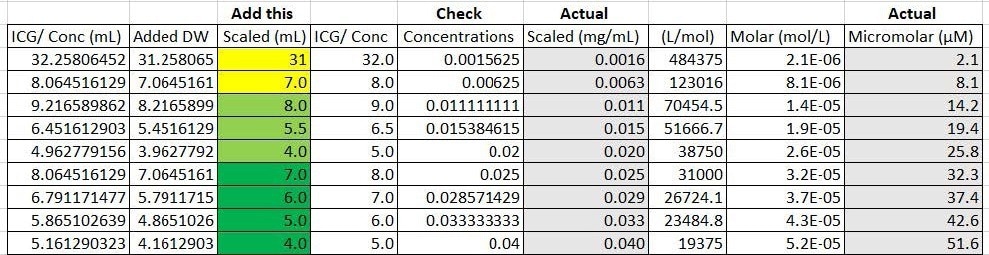
Figure 4. Calculations of actual concentrations and micromolar range from theoretical values. Image Credit: Avantes BV
One milliliter of base concentration was later introduced to the highlighted values to achieve the desired concentration. Additional calculations were run to establish the actual concentrations based on the amount of sensitivity the measuring and weighing equipment offered. The actual concentrations were subsequently converted back to micromolar to observe a more accurate range of the concentrations made (Figure 4). The final nine concentrations are displayed in Figure 5.
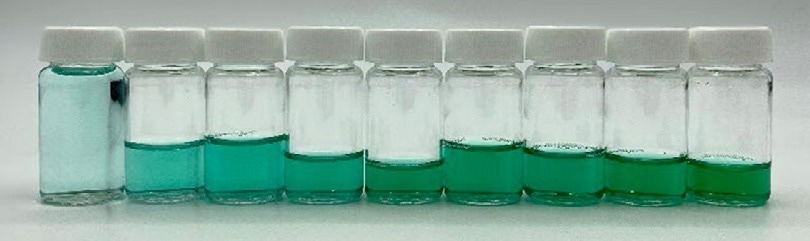
Figure 5. Different concentrations of ICG with distilled water. Image Credit: Avantes BV
Test Data and Results
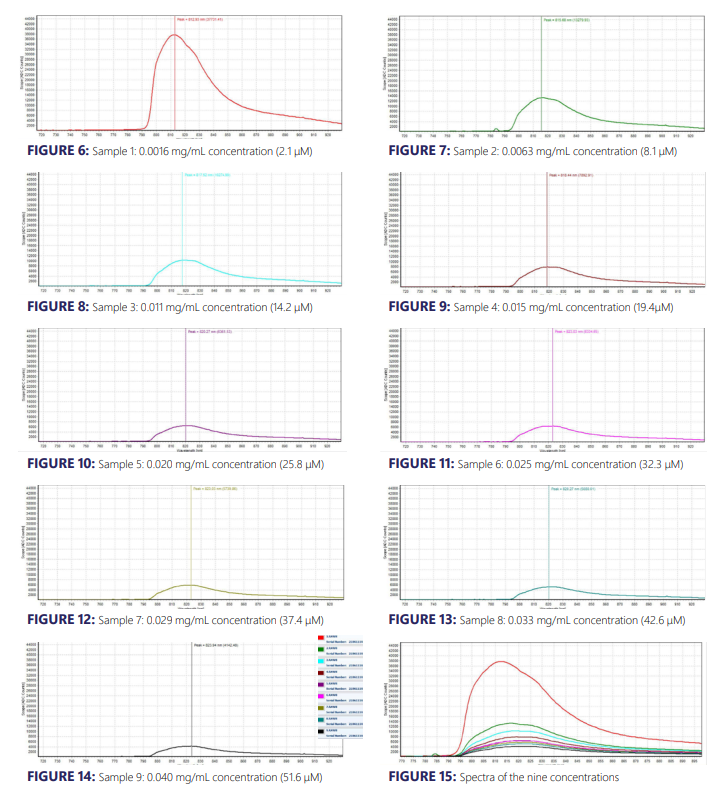
The experimental results from the ICG fluorescence measurements are shown in Figures 6 – 15. For the experiment’s raw scope, A/D counts from the spectrometer are employed as opposed to calibrated fluorescence counts generated by a radiometric calibration of the spectrometer’s sensitivity. An alternative way to conduct this experiment in the future could include re-measurement with a radiometrically calibrated spectrometer.
Analysis
From the spectra received, the trend of fluorescence peaks demonstrates that the samples that were more concentrated had shallower fluorescence spectrums but greater maximum peaks. For instance, sample 1 (Figure 6) had a concentration of 0.0016 mg/mL with the largest spectrum and had a maximum peak of 812.93 nm.
The concentration of sample 2 (Figure 7) was 0.0063 mg/mL with the second-largest spectrum and had a maximum peak of 815.68 nm. This pattern was relatively consistent across all of the samples. ICG emits fluorescence between 750 nm and 950 nm with maximum values around 810 nm when dissolved in water. The sample’s maximum peak values were in ranges between 812.93 nm to 823.94 nm.
The acquired spectra matched the literature describing fluorescence emission. Generally speaking, the greater the concentration of a dye, the more fluorescence it emits. However, in this instance, ICG does the exact opposite. ICG has unique properties that may be the cause of this. For example, ICG has close excitation and emission spectra that typically leads to the detection of the excitation light together with the emission signal.
The excitation emission of ICG is approximately 790 nm. The crossover of spectra demonstrates concentration-dependent fluorescence quenching. Quenching pertains to any process that reduces the fluorescence intensity. Excited-state reactions, energy transfer, and formational collisions can all lead to quenching. Dr. Black, with the Medicine and Biology Society, describes this phenomenon by explaining that ICG’s molecules are close enough to self-absorb the fluorescence photons and, by some internal conversion mechanism, convert this energy into vibration (heat). The true explanation of the ICG fluorescence trend is not fully understood.
ICG is notorious for exhibiting interesting and non-linear readings. The chemical and spectroscopic properties of ICG can result in the quenching of solutions. However, the same trend does not always follow in various medical applications.
When injected into the human body, ICG responds in a completely different manner than when tested with distilled water with no additional host materials. In various applications, it is not possible to read ICG at any concentration.
Some of the host materials with the best medical implant properties do not have the capacity to read ICG. Similar to this, when running the ICG solutions with greater concentrations, some host materials produce an almost black coloring that absorbs all the light and does not enable a proper reading.
Conclusion
Indocyanine Green and fluorescence imaging testing offer significant advantages to a variety of medical applications. The powdered green dye can reach the Near-Infrared range (NIR), which facilitates deeper imaging in the tissue optical window. ICG is non-toxic, relatively cheap, and easy to use in medical applications. It is a great asset to fluorescence testing and today is the most popular imaging mode in use.
However, ICG remains to be tried and tested to its full potential. Many properties of ICG, particularly those of fluorescence, are unknown and cannot be fully accounted for. By running this experiment, a number of key factors of ICG fluorescence testing were validated:
- The relative concentration of the ICG is key. The concentration needs to be calculated correctly based on the solvent and/or host material, or the instrumentation will not be able to read the spectra.
- The system assembly must be able to block out the excitation-emission. In this experiment, a 785 nm Raman laser light source and a long pass filter were employed to ensure that the excitation-emission did not adversely interfere with the fluorescence emission.
- With the low concentration samples, a darkroom was necessary during testing so that the reflectance probe would not be influenced by the ambient light.

This information has been sourced, reviewed and adapted from materials provided by Avantes BV.
For more information on this source, please visit Avantes BV.