Sponsored by EDAXJan 31 2023Reviewed by Olivia Frost
Stainless steel is used in situations where surface aesthetics are crucial. These may include kitchen countertops, cabinet fronts, and external and interior cladding. As stainless steel is primarily utilized for its look, oxidation must be minimized so that it does not detract from the aesthetic of the finished product.
However, existing scale removal procedures may not be enough to remove all oxides following slab reheating. These oxide scale remains may be forced into the surface of the material during rolling, which is unsatisfactory to both the maker and the consumer. This investigation examines the scales formed on stainless steel during industrial shaping.
Electron Backscatter Diffraction (EBSD) and Chemical Indexing Scan (ChI-ScanTM), which integrates the structural information acquired with EBSD with the full spectrum chemical information measured with Energy Dispersive Spectroscopy (EDS), were used to examine the microstructure and probable phase distributions of the scales.
Sample Preparation
Four hours were spent oxidizing 316 L stainless steel samples in a box furnace using laboratory air at 1200 °C. After oxidation, they were mounted in edge-retaining conductive bakelite, metallographically prepared with grades of silicon carbide paper ranging from 80 to 2400 grit, 6 and 1 m diamond polish, and finally polished for at least 25 minutes with colloidal silica solution.
It is essential to highlight that the purpose of the preparation was to make the ceramic oxide scale suitable for analysis. The oxide scale is fragile and must be handled more carefully than a metal sample. The Leo 1530 VP field emission gun equipped with EDAX EDS and EBSD systems at the Loughborough Materials Characterization Centre was the SEM utilized to analyze materials.
Variations were made to the working distances and operating voltages to provide optimal EDS and EBSD imaging conditions. Backscatter imaging was used to capture the picture of a scale shown in Figure 1.
Phase Identification Using ChI-Scan
The backscattered image (Figure 1) of a scale grown on 316 L stainless steel after being exposed to a temperature of 1200 °C for four hours, demonstrates the presence of three distinct layers in the scale. The bottommost layer seems porous and composed of fine-grained particles, the middle layer has a larger grain size, and damage caused by polishing is visible.
The top layer appears to be less damaged than the intermediate layer. Nevertheless, such a picture gives some microstructural information. A map of EBSD image quality (IQ) (Figure 2) gives further information on the grain structure.
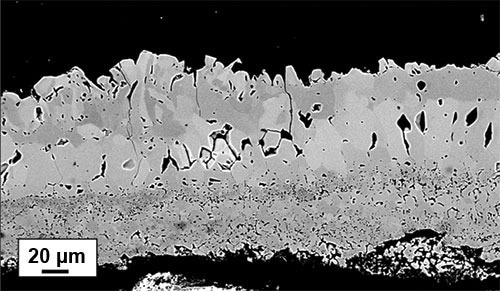
Figure 1. Backscatter electron micrograph of an oxide scale formed on 316L stainless steel after four hours at 1200 °C. Image Credit: EDAX.
Figure 2 displays the same scale as depicted in Figure 1. This image illustrates that the oxide layer closest to the substrate (layer 1) is composed of very fine-grained particles, the middle layer (layer 2) consists of larger equiaxed grains, and the top layer (layer 3) appears more disordered, with the presence of some elongated thin grains at the top edge.
It can be challenging to accurately differentiate between the three layers utilizing EBSD alone as the phases present possess similar crystallographic structures. Combining the IQ map with EDS data collected simultaneously during the EBSD scan provides valuable information, as shown in Figure 3, that aids in distinguishing between the layers and revealing the spatial distribution of phases both between and within the layers.
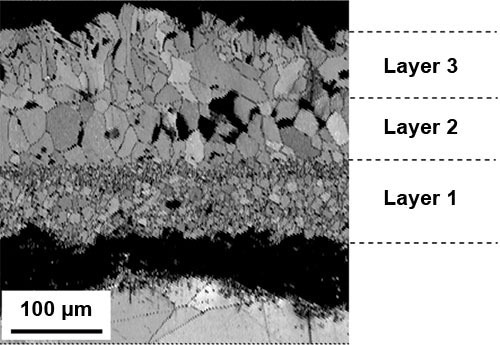
Figure 2. EBSD IQ map of an oxide scale formed on 316L stainless steel after four hours at 1200 °C in air and cooled in the air at room temperature. Image Credit: EDAX.
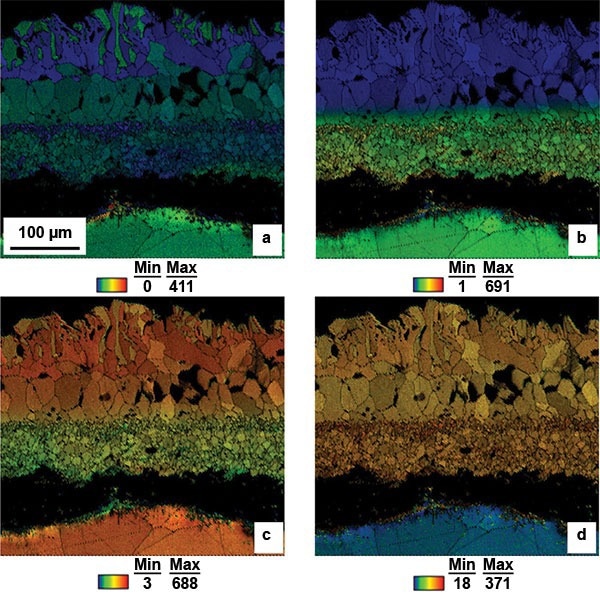
Figure 3. EDS maps of a) nickel, b) chromium, c) iron, and d) oxygen in an oxide scale formed on 316L stainless steel after four hours at 1200 °C in air and cooled in the air at room temperature. Image Credit: EDAX.
From the EDS information illustrated in Figure 3, it is obvious that four distinct chemical phases are present within the three layers. Figure 3a is a nickel map superimposed on an IQ map. This figure demonstrates that nickel is distributed evenly throughout the equiaxed grains of layer 2.
However, this type of distribution is unique to this layer. A significant number of grains in layer 1 have a high nickel content, but many also contain very little nickel. In contrast, the upper layer (layer 3) presents a majority of grains with low nickel content, except for some grains along the upper edge of the scale that exhibit a high nickel content.
The chromium map (Figure 3b) depicts that only layer 1 is abundant in chromium, while the rest of the scale displays minimal chromium. This layer also presents some grains towards the top and bottom of the layer that have a higher nickel content.
The iron map (Figure 3c) illustrates that the iron content increases toward the top edge of the scale. Additionally, the grains that exhibit a high nickel content on the top edge of the scale also display a lower iron content than the rest of layer 3.
For every one of the four chemical phases identified in the EDS maps, a corresponding crystallographic phase was selected from a database of diffraction patterns using the chemical composition and EBSD indexing as search criteria.
The four distinct phases identified were hematite and three spinels: chromium, nickel-iron oxide, and chromium-iron oxide. The data was collected simultaneously by EBSD and EDS and was then differentiated by using both crystallographic structure information and chemical composition data, a process known as ChI-Scan. The rescan considered the austenitic stainless steel that lay beneath the scale.
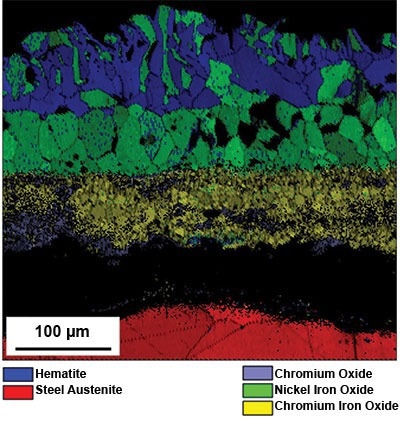
Figure 4. Map of the phases present within a scale formed on 316L stainless steel after four hours at 1200 °C in air and cooled in the air at room temperature. Image Credit: EDAX.
The phase map displayed in Figure 4 illustrates the presence of four possible phases within the three oxide scale layers. The closest layer to the substrate is a mixed-phase layer, a nickel-iron oxide layer in the middle, and a hematite layer on the top edge of the scale.
While some grains of nickel-iron oxide are found on the top edge of layer 3, indexing the hematite layer would be relatively uncomplicated if a phase map were to be produced without the use of ChI-Scan.
This is because the hematite layer possesses a distinct crystal structure (hexagonal) as compared to the majority of the scale, which consists of various spinel oxides (face-centered cubic). However, it would be extremely difficult to differentiate between the individual spinels solely based on their crystallographic data.
When the EDS information is incorporated into the phase differentiation process using ChI-Scan, the spinels are easily distinguished. The nickel-iron oxide is distinguished by its high nickel content, while the chromium oxide is identified by its high chromium content and low iron content. Chromium-iron oxide is characterized by its high content of both chromium and iron.
Conclusion
ChI-Scan offers the capability of combining EDS and EBSD analysis results, which allows analysts to differentiate effectively between oxide scales grown on stainless steel samples that are chemically dissimilar but crystallographically similar. This analysis enables process engineers to remove the relevant oxide scale from the final product.
References
Images were taken from:
- M. Jepson & R.L. Higginson (2005) The Use of EBSD to Study the Microstructural Development of Oxide Scales on 316 Stainless Steel, in High-Temperature Materials 22: 195-200
General papers detailing this and similar work on oxide scales:
- G. D. West, S. Birosca and R. L. Higginson (2005) Phase determination and microstructure of oxide scales formed on steel at high temperature, Journal of Microscopy 217: 122-129
- R. L. Higginson and G. D. West (2005). The Study of Texture Development of High-Temperature Oxide Scales on Steel Substrates using Electron Backscatter Diffraction, Materials Science Forum 495-497: 399-404
- R. L. Higginson, G. D. West and M. A. E. Jepson (2007). The Characterisation of Oxide Scales Grown On Nickel Containing Steel Substrates Using Electron Backscatter Diffraction, Materials Science Forum 539-543: 4482-4487
- S. Birosca and R. L. Higginson (2005) Phase identification of oxide scale on low carbon steel, Materials at High Temperatures 22: 179-184
- R. L. Higginson, M. A. E. Jepson and G. D. West (2006) Use of EBSD to characterise high-temperature oxides formed on low alloy and stainless steels, Materials Science and Technology 22: 1325-1332

This information has been sourced, reviewed and adapted from materials provided by EDAX.
For more information on this source, please visit EDAX.