Sponsored by Metrohm AGMay 23 2023Reviewed by Olivia Frost
Ensuring the quality and safety of food products is paramount in the food industry, particularly in the production of confectionery items. Stringent quality control measures are necessary to meet regulatory requirements and to maintain consistent product quality. This is especially crucial for indulgent products like chocolate.
Image Credit: ShutterStock/gresei
Near-infrared spectroscopy (NIRS) is a rapid and non-destructive analysis technique that enables the determination of several significant quality control parameters of chocolate bars without sample preparation. The NIRS approach is user-friendly and can be employed in a quality control laboratory or atline.
Experimental Equipment
The Metrohm DS2500 Solid Analyzer (Figure 1) analyzed 18 chocolate bars from various suppliers. The chocolate bars were placed directly onto the sample window and measured in diffuse reflection mode.
To ensure sample diversity, each chocolate bar was assessed at three different locations, and the resultant spectra were averaged to develop the model. The data acquisition and prediction model were created using the Vision Air Complete software package (Table 1).
Table 1. Hardware and software equipment overview. Source: B&W Tek
| Equipment |
Article number |
| DS2500 Solid Analyzer |
2.922.0010 |
| Vision Air 2.0 Complete |
6.6072.208 |
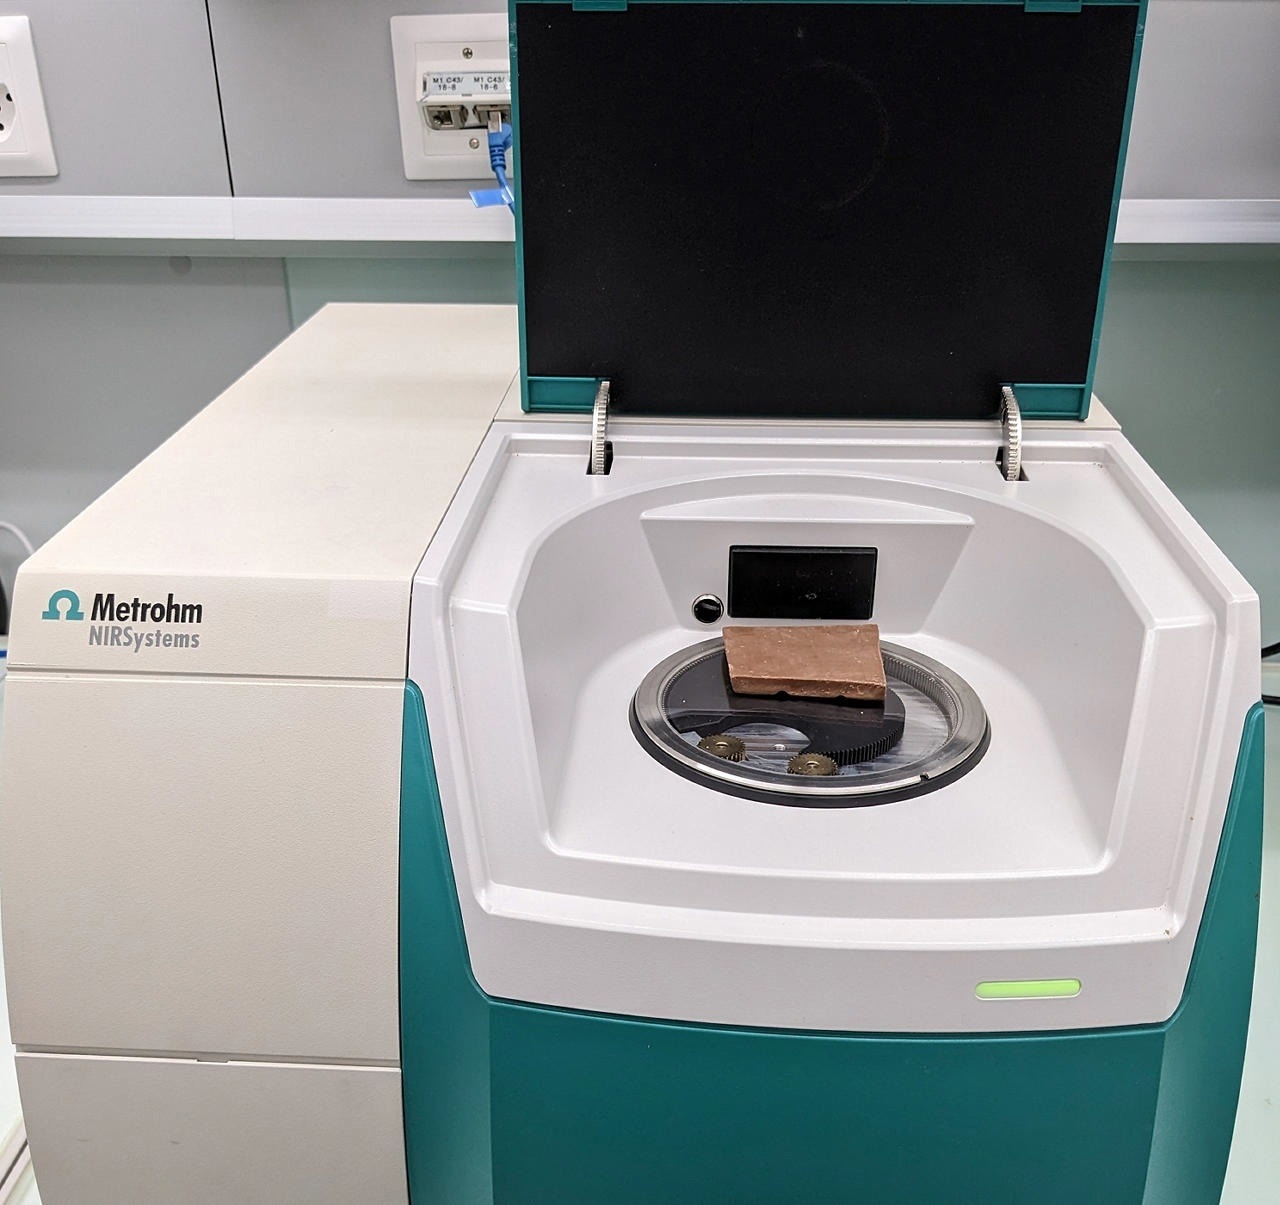
Figure 1. Metrohm NIRS DS2500 Solid Analyzer with a chocolate bar covering the sample window. Image Credit: B&W Tek
Result
The acquired Vis-NIR spectra (Figure 2) generated prediction models for the various reference parameters.
To validate the models, a leave-one-out procedure was employed. The correlation diagrams, which illustrate the relationship between the Vis-NIR prediction and the reference values, are presented in Figures 3-8, alongside the corresponding figures of merit (FOM).
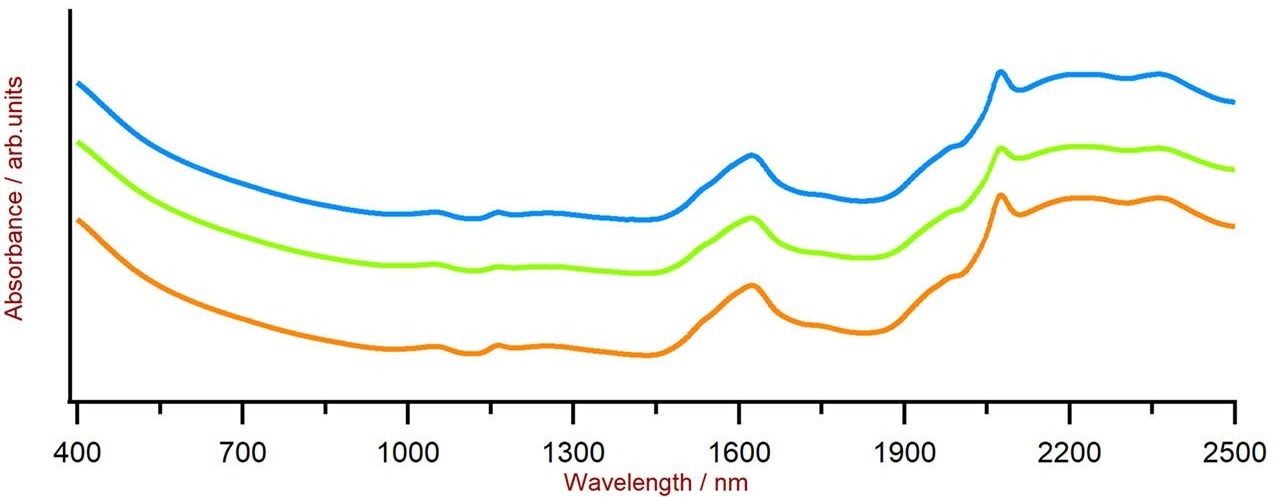
Figure 2. Selection of Vis-NIR spectra of chocolate bar samples. Data was obtained with a DS2500 Solid Analyzer. A spectra offset was applied for visualization purposes. Image Credit: B&W Tek
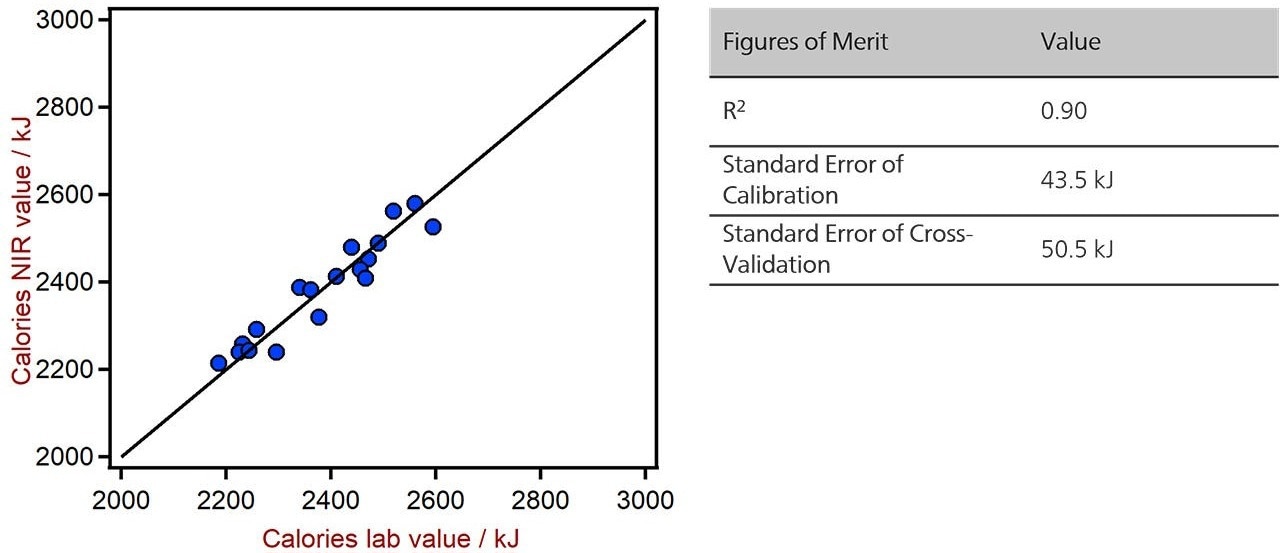
Figure 3. Correlation diagram and the respective FOMs for the prediction of calories in chocolate bars using a DS2500 Solid Analyzer. Image Credit: B&W Tek
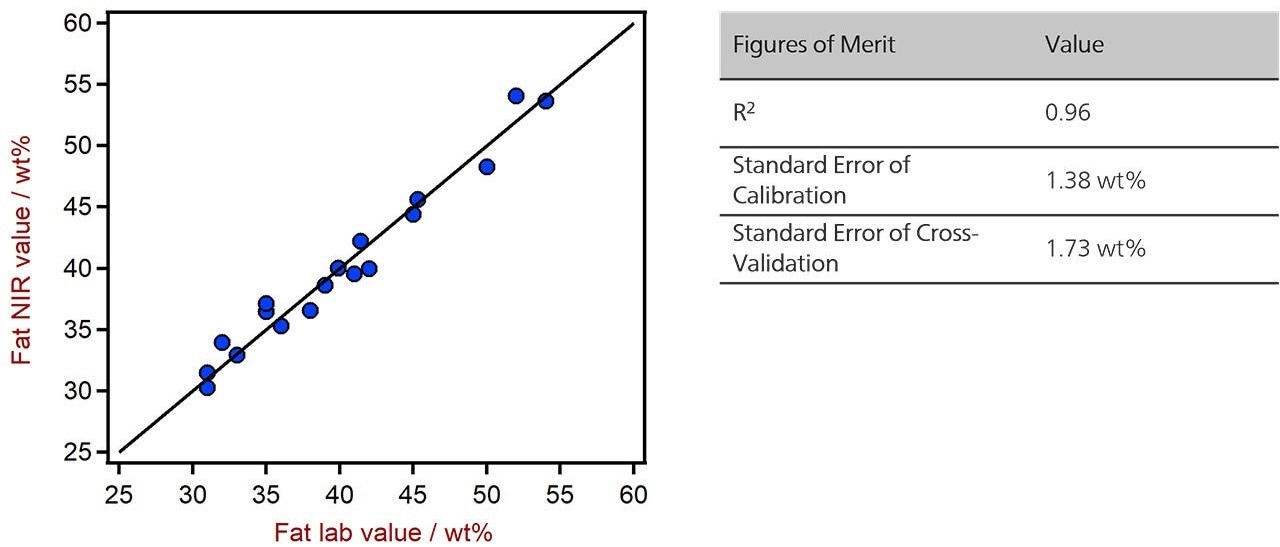
Figure 4. Correlation diagram and the respective FOMs for the prediction of fat in chocolate bars using a DS2500 Solid Analyzer. Image Credit: B&W Tek
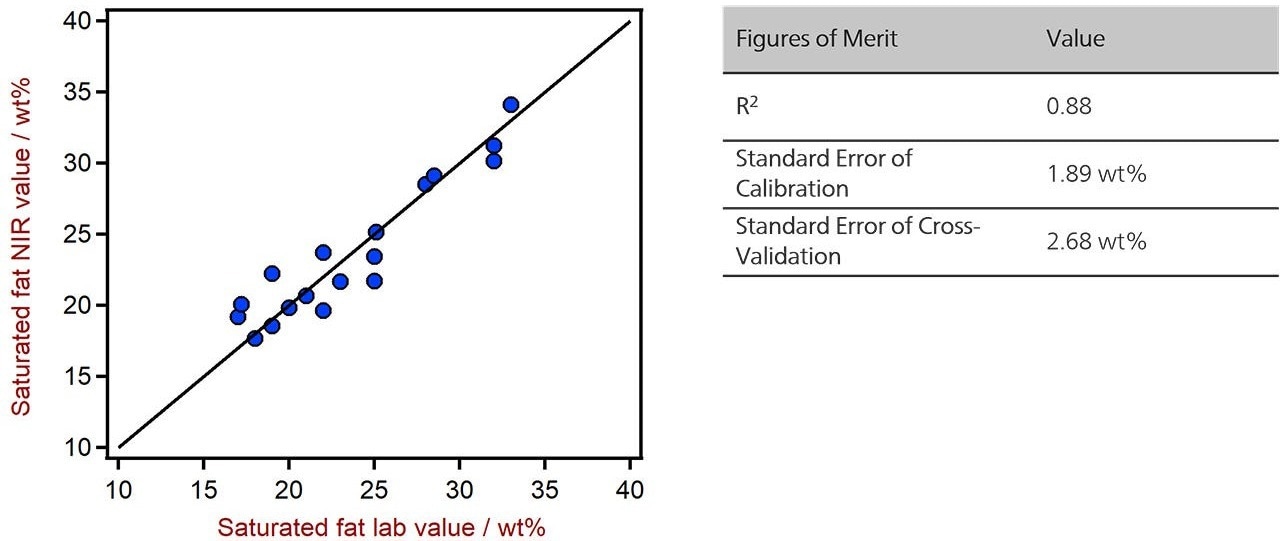
Figure 5. Correlation diagram and the respective FOMs for the prediction of saturated fat in chocolate bars using a DS2500 Solid Analyzer. Image Credit: B&W Tek
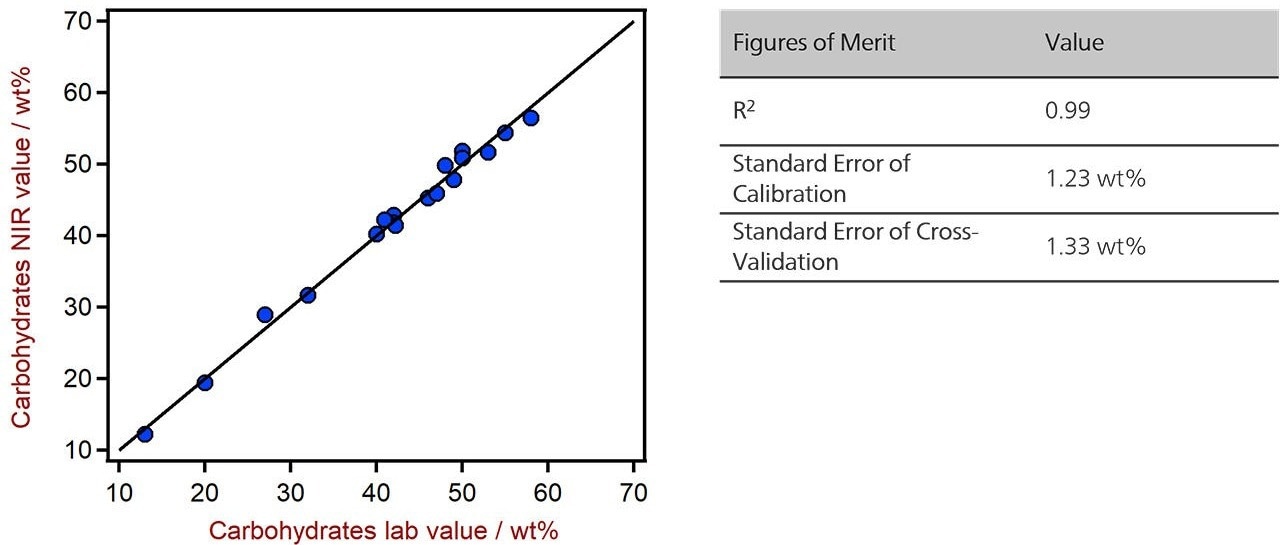
Figure 6. Correlation diagram and the respective FOMs for the prediction of carbohydrates in chocolate bars using a DS2500 Solid Analyzer. Image Credit: B&W Tek
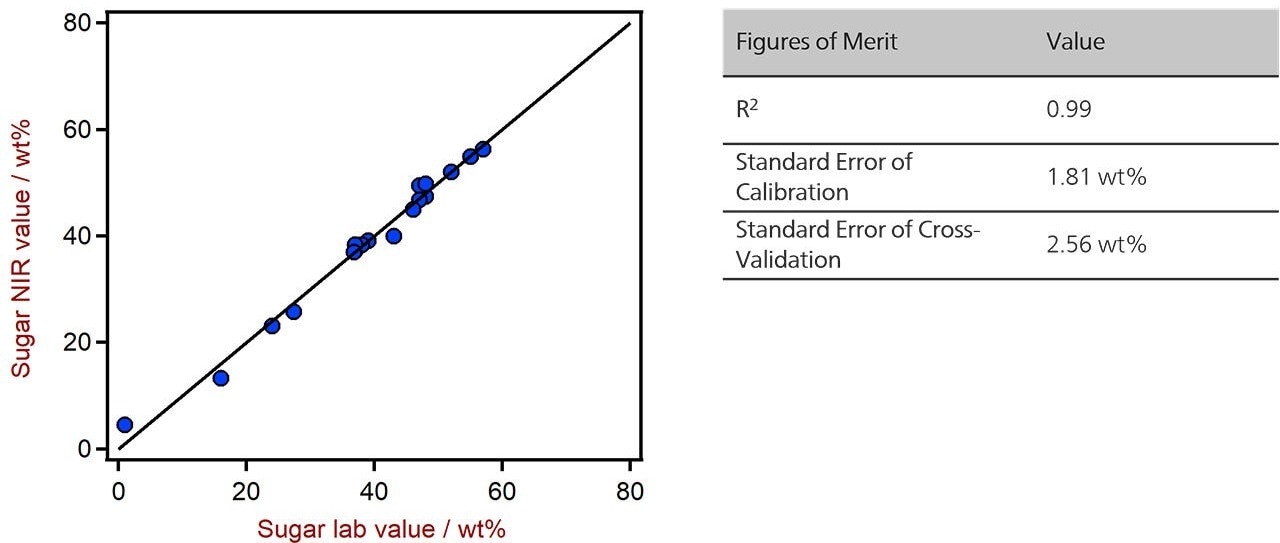
Figure 7. Correlation diagram and the respective FOMs for the prediction of sugar in chocolate bars using a DS2500 Solid Analyzer. Image Credit: B&W Tek
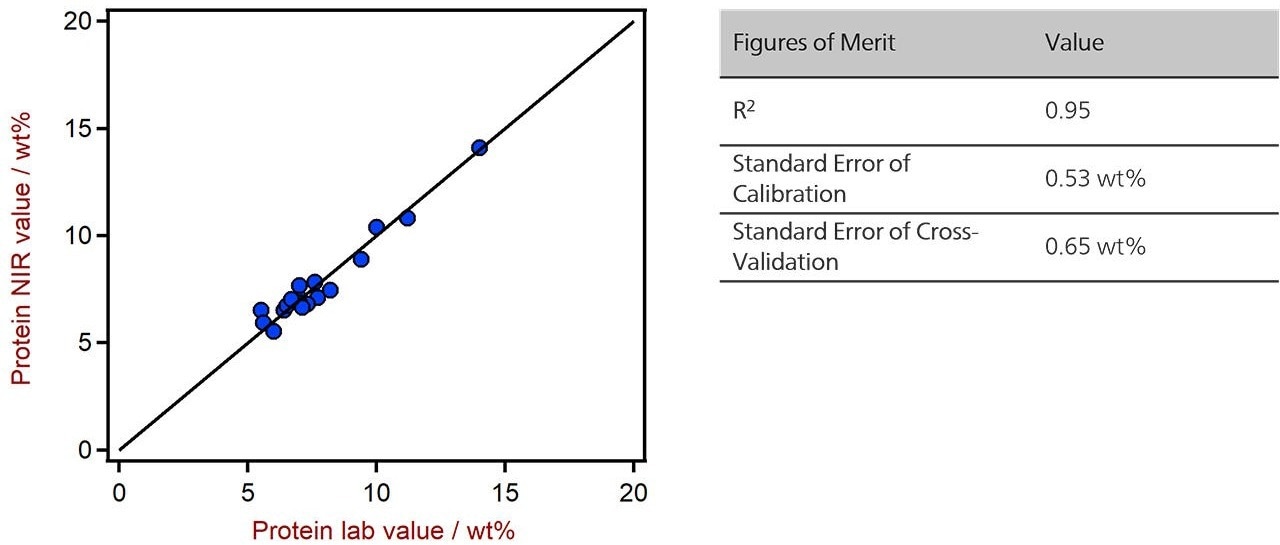
Figure 8. Correlation diagram and the respective FOMs for the prediction of protein in chocolate bars using a DS2500 Solid Analyzer. Image Credit: B&W Tek
Conclusion
This article demonstrates the potential of near-infrared spectroscopy (NIRS) in analyzing the calorie, fat, saturated fat, carbohydrate, sugar, and protein content in chocolate bars.
NIRS offers a substantial reduction in both time and costs when compared to traditional analysis techniques used to determine these quality parameters. NIRS provides users with quick and dependable results, without chemical reagents.

This information has been sourced, reviewed and adapted from materials provided by B&W Tek.
For more information on this source, please visit B&W Tek.