In this interview, AZoM talks to Jaspreet Singh from Thermo Fisher Scientific, about how FTIR microscopy can be utilized in failure analysis and the implications this has in the industry.
Please can you introduce yourself and the Thermo Scientific Nicolet RaptIR FTIR Microscope?
Hello, I am Jaspreet Singh. I will introduce the new research-grade Thermo Scientific Nicolet RaptIR Microscope and discuss its use in failure analysis applications. I will discuss failure analysis, introduce FTIR microscopy and some of its features, and explain some case studies of the Nicolet RaptIR FTIR Microscope.
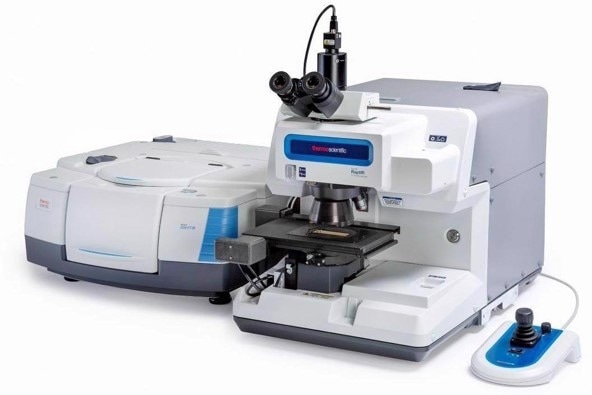
Image credit: Thermo Scientific - Chemical Analysis
What is failure analysis?
We can think of failure analysis as one of the first steps in fixing the cause of a problem. This multidisciplinary investigation utilizes many analytical techniques to understand the cause of a failure in equipment, processes, or products. Ultimately, the information gathered using our various techniques should help us to resolve the issue.
Failure analysis can be found in almost every industry, with examples including the electronics, metals, and medical fields. Failure analysis labs can be found in both industrial and R&D settings.
A simple workflow for failure analysis identifies the failure, investigates the issue, determines a root cause, and produces the solution. The investigation portion of this workflow is where this interview fits in.
The analytical methods used in failure analysis can be broadly categorized into destructive and non-destructive techniques. Destructive techniques, such as taking cross-sections or physically taking the sample, are more invasive but can be necessary.
Non-destructive methods, such as visual inspection or microscopy, are preferred to keep the sample intact and allow for multiple complementary analyses. FTIR microscopy fits into this non-destructive category.
What is FTIR microscopy and how does it differ from regular FTIR?
Traditional Fourier transform infrared microscopy (FTIR microscopy) studies the interaction of infrared radiation of matter.
FTIR can analyze samples in different modes, such as transmission or attenuated total reflection (ATR). This provides us with IR spectra with peaks, which we can use to understand the sample's molecular structure or utilize in conjunction with spectral libraries for identification.
FTIR microscopy works in much the same way. However, incorporating our system into a microscope allows us to study samples on a much smaller scale, which would be untenable for regular FTIR.
Like regular FTIR, FTIR microscopy is non-destructive, can analyze your samples by transmission, reflection, or ATR modes, and provides IR spectra that can be used for identifying molecular structures or quick library searching.
Here we have a few samples of analysis using an FTIR microscope, including in pharmaceuticals where we can map the distribution of an active pharmaceutical ingredient, identify microplastics from environmental samples, or for forensic analysis in which we study inks.
How are the features of the Nicolet RaptIR advancing FTIR microscopy?
The Thermo Scientific™ Nicolet™ RaptIR™ FTIR Microscope gives us both our traditional eyepieces as well as a five-megapixel camera to look at our sample, a liquid nitrogen cooled detector for high-sensitivity measurements, optional automated visible and infrared polarizers, a motorized nosepiece with 4x and 15x objectives, and a stage with 40-millimeter working distance and five-kilogram capacity.
The system is coupled with a joystick that allows for easy illumination, X, Y, and Z stage control, and stage movement and speed control, all in a single interface.
The Nicolet RaptIR FTIR Microscope has many features that make it a great asset. This includes taking a microscopy-first approach that is image-centric by providing users with a high-quality, large field-of-view mosaic that is captured using the 4x glass objective and in conjunction with the automated nose piece, automatically brings in the 15x objective for acquiring our IR data.
This automated approach to the objectives means you no longer have to hunt for your sample. The increased working distance and staged weight capacity allow the analysis of uniquely shaped and precious samples. This microscope also brings with it a high spatial resolution. Spatial resolution can be below five microns in transmission mode.
What benefits does the OMNIC Paradigm Software provide?
One of the significant updates comes from the accompanying Thermo Scientific™ OMNIC™ Paradigm Software. This is a 64-bit software that improves speed and resource usage, remains compatible with all historical OMNIC data files and libraries, allows for multiple maps on a single sample, and provides a highly automated approach to our analysis.
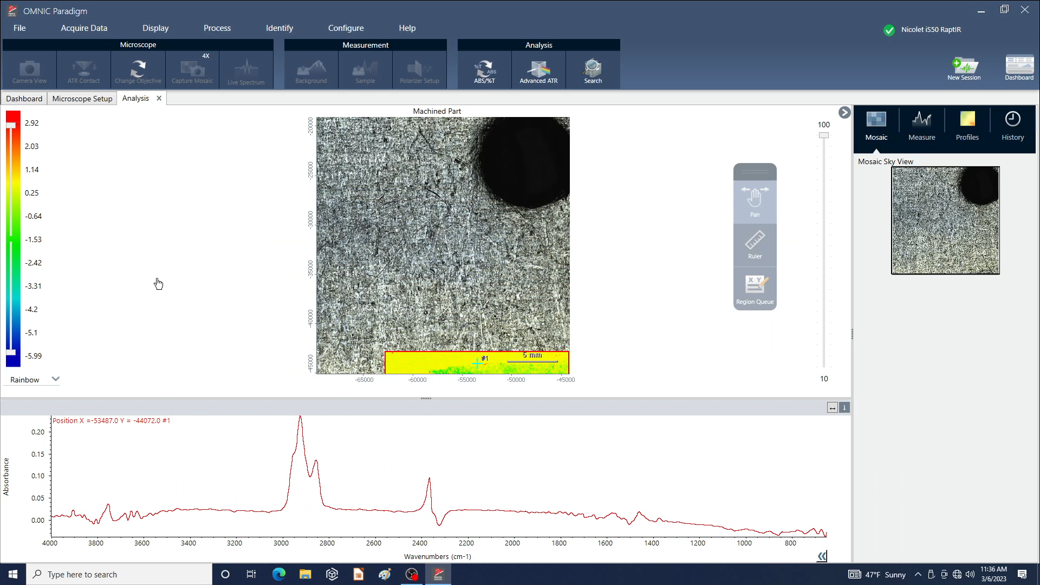
Image credit: Thermo Scientific - Chemical Analysis
Can you describe the Nicolet RaptIR workflow in failure analysis?
I will apply the workflow to a case study on printed circuit boards, commonly called PCBs. PCBs can be found in many modern electronics, from simple items like toys to everyday necessities like our cars, and more complex parts such as aerospace components.
PCBs are a critical component of modern electronics and great care is taken to ensure the quality of PCB boards. However, issues can still arise.
In a case study, a PCB designed for a consumer electronic failed a visual inspection. A white residue was noted on the board. We used the Nicolet RaptIR FTIR Microscope to investigate this residue, understand its origins, and help identify the failure.
First, we set up our experiment in the OMNIC Paradigm Software. When you first open the OMNIC Paradigm Software, you are greeted by the dashboard, where you can set and save your measurement settings or start measuring your new sample.
You can continue resuming your work on previously collected data and access any automated workflows designed. The dashboard allows easy access to all these options from a single screen.
I will focus on measurement settings to set parameters for data collection. This is where we can dictate the format we want to view our data.
We can change the number of sample scans and select a preset for capturing our visual mosaic. We can select the camera profile based on the sample characteristics, give our sample a tag that is user-searchable in the future, select our resolution, and pick our collection mode from reflection transmission or ATR. Finally, we can adjust our step size and aperture height and width.
Additional settings include background handling and advanced parameters, such as mapping speed and apodization.
Once all these parameters have been defined, a user can create a new settings profile that will populate in the quick access dropdown for easy selection. These parameters can be saved as presets and tagged for easy use in the future. In a regular workflow, a user can very quickly select a preset from the dropdown, give the sample a searchable tag, and be ready to start collecting data in seconds.
The Nicolet RaptIR is going to first auto-illuminate our sample for us. Immediately after finding the right illumination, the system starts to autofocus the sample, and we can see the stage moving up and down as this focus is finalized. These initial steps made capturing our mosaic a simple procedure in which the user starts the session and lets the Nicolet RaptIR take care of the work.
After the focus is finalized, the system will capture images to generate a mosaic. We see that the mosaic is being stitched together here, and a final image will be presented to us shortly. This mosaic captured by the 4x objective provides us with a large field of view to comprehensively examine our sample. Our motorized nosepiece kicks into action and brings in our 15x IR objective as soon as the mosaic gets finalized. The Nicolet RaptIR Microscope is once again doing the heavy lifting.
With the IR objective in place, it begins by finding the right illumination and then getting the proper focus. The stage makes tiny adjustments to get the focus right with our IR objective in place. Once the focus is finalized, the system is ready for us to take over and start collecting data. The user clicks the start session button, and the Nicolet RaptIR takes care of the rest.
We now have a large mosaic to guide our analysis and could use the new options in the microscope tab to help us collect our data. Here we have options to get a live camera view. We can adjust our ATR contact settings, rotate our objectives to capture additional mosaics, and have access to basic processing.
There is also a floating toolbar that houses all the tools needed to capture data and a pane on the right that captures all the information associated with a particular session, including any captured mosaics, sample data, and any profiles we generate.
When opening up the camera view, a red box in our large visual mosaic shows us our live view region. You can use the onscreen controls to move the stage and get a live view of different points on the PCB board. You can also select the stage move tool on the floating toolbar to find new areas of interest just by clicking on the visual mosaic.
By zooming into the visual mosaic, you can compare the residue and clean regions on the PCB. When looking at these, it is clear that the residue visually appears to be quite different from other clean parts of the PCB board.
You would then drop points to the sample. The first point would be the relatively clean region, and the second would be the region containing the residue. You select the point tool and put a point in a clean area by clicking on the mosaic and a second point on the dark residue area.
With these points dropped, the ATR contact option can be selected and we would begin to define ATR parameters. The ATR crystal is inserted, and you can see that on the live camera view. With the ATR crystal inserted, the RaptIR sensor recognizes the crystal is in place, and we can zoom in on the ATR crystal to get a better look.
We can then adjust the pressure and change the release distance. Once those values are input, the system takes over.
Once selected, it drops the stage and automatically takes a background. Once the background collection is complete, it will move over the first sample point, make contact at the set pressure, and begin collecting data. Immediately after collecting data from the first sample, the stage will automatically move over to the second point and repeat.
Once our system is finished collecting data, we can view the mosaic and the points where we acquire our sample spectra. As we click on the different points, the appropriate hash marks will be highlighted on our mosaic, and we will see the associated spectrum displayed. We can quickly compare two spectra and immediately see that the IR data shows us two different materials.
The system will match different materials to a library in a data summary. In the PCB case study, we end up with a mosaic that visually shows a difference between two points, spectra that are unique from one another, and library matches that verify we have two different materials.
The Nicolet RaptIR FTIR Microscope showed that we have a PCB board with residues that are unlike the board substrate. The residue matched for Thixatrol ST, which is a rheological component added to flux and is critical in solder paste printing.
The presence of this material suggests improper cleaning of the board after soldering, which may have arisen from a change in the cleaning process, a change in the flux material itself, or the chemicals being used for the cleaning.
In this case study, we see how the Nicolet RaptIR FTIR Microscope automatically captures our visual mosaic while handling the illumination focus, and it quickly gives us information of our unknown material, providing some valuable data to try and identify the root cause of the issue.
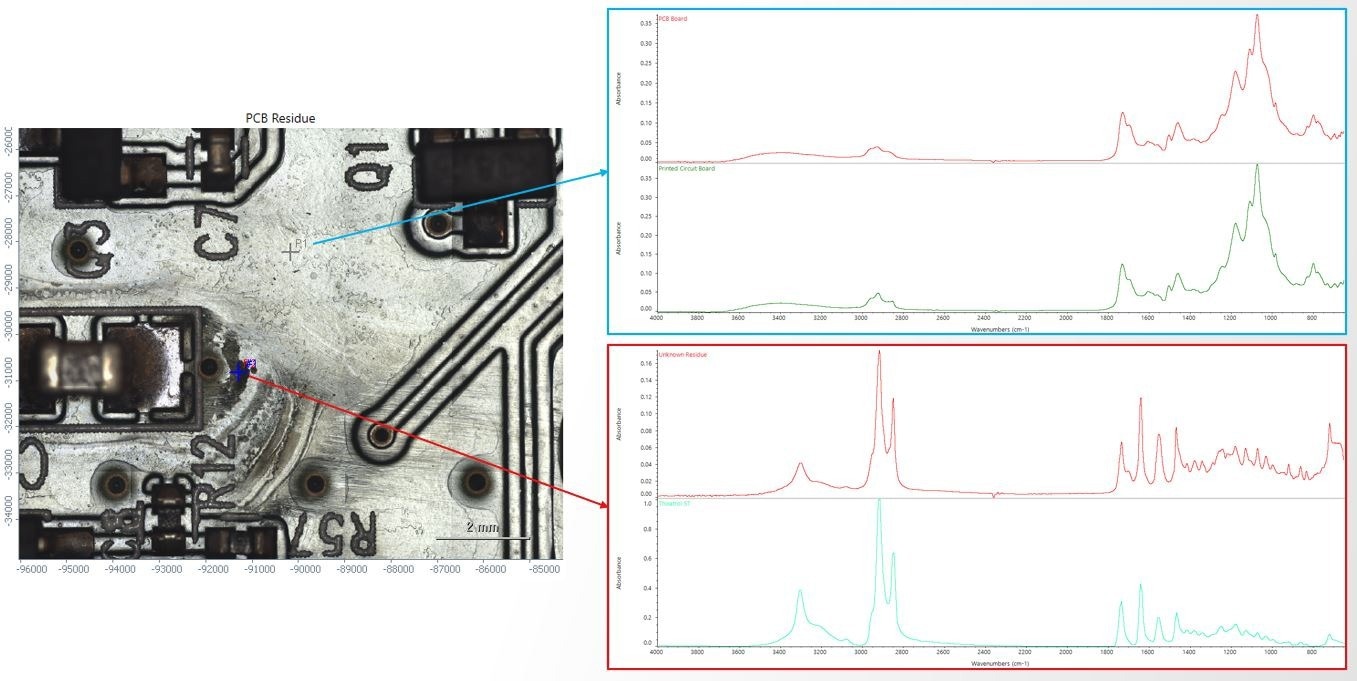
Image credit: Thermo Scientific - Chemical Analysis
How could the Nicolet RaptIR be used across failure analysis in different industries?
The previous case study showed an example of its use in electronics. But we have several other case studies, including paper processing and adhesives.
In paper processing, products destined to produce printer paper may require sheets with minimal defects, whereas those destined for hand towels may be less stringent. In a case study, sheets of final printer paper product were returned to the factory by the end user after they identified unknown materials that were not caught in the final inspection at the factory.
Using the same experiment preset used in our PCB board case study and an ATR analysis, we could try to identify the defect particles.
Spectrums were acquired of the visual mosaic, the defects, and the clean paper regions. The spectrum of that spot matched Talc, a common additive in paper processing. We also noted additional bands in the spectrum, suggesting other components mixed in with the Talc. Talc deposits may form during changes in temperature or pH. This analysis allowed the production team to review its parameters and correct any issues quickly.
For this analysis, as settings were picked from the dropdown, the data was acquired in a few minutes, allowing for a rapid turnaround. With its automation and speed, the Nicolet RaptIR provided results for a product failure, guiding corrective actions for the manufacturing team.
Please can you summarize the benefits of the Nicolet RaptIR FTIR Microscope?
The Nicolet RaptIR FTIR Microscope is easily used, making it an excellent tool for novice and experienced microscopists. The image-centric software provides high-quality visuals that accompany great IR data. Meanwhile, the system's automation makes getting data more accessible than ever. The software is intuitive and allows for easy capture and viewing of data and the generation of chemical images for mapping.
The Nicolet RaptIR FTIR Microscope can be applied to failure analysis across different industries, providing rapid analysis in a non-destructive manner that allows the end user to generate actionable items to prevent future failures.
About Jaspreet Singh
Jaspreet earned his B.S. in Chemistry from the University of California, Merced in 2012 and his Ph.D. from the University of Oklahoma in 2021. Jaspreet’s graduate research work focused on variable temperature infrared spectroscopy studies of materials and development of FTIR sampling methods.
Jaspreet is currently an Application Scientist for the Nicolet FTIR spectroscopy product line at Thermo Fisher Scientific and operates an applications lab in San Jose, CA.

This information has been sourced, reviewed and adapted from materials provided by Thermo Fisher Scientific – Chemical Analysis.
For more information on this source, please visit Thermo Fisher Scientific – Chemical Analysis.
Disclaimer: The views expressed here are those of the interviewee and do not necessarily represent the views of AZoM.com Limited (T/A) AZoNetwork, the owner and operator of this website. This disclaimer forms part of the Terms and Conditions of use of this website.