Introduction Semiconductor nanoparticles (quantum dots) have been investigated over the past years due to their specific optic, electronic and catalytic properties. These properties emerge from the high surface-to-volume ratio present in nanoparticles. Therefore, we have to be able to control and modify nanoparticles surface in order to control their properties. This surface modification can be done by chemical methods [1, 2, 3] and has been subject of extensive investigation. Passivation is achieved mostly by capping of the particles with organic, but also with inorganic materials. Colloidal CdS particles have been passivated by Cd(OH)2, with a dramatic increase in fluorescence observed [4]. Eychmüller publishes a complete overview on synthesis of onion-like nanoheterostructures based on CdS layers [5]. Organic ligands such as thiopyridines and thiolates have been reported to minimize surface defects and increase luminescence efficiencies [6]. Cadmium chalcogenides are well studied materials [7, 8] due to, among other interesting properties, their well established relationship between the optical absorption and their size. Cadmium sulfide could be used as bioorganic detector [9] of proteins [10] or DNA [11, 12]. With a good surface modification we can obtain, with cadmium sulfide, core/shell nanoparticles [13, 14], which have enhanced luminescence properties. In this work, cadmium sulfide nanoparticles were synthesized using a simple aqueous precipitation, this method is not time consuming and can be developed at room temperature. A stabilizing agent 3-mercapto-1,2-propanediol was used in order to prevent particle growth and agglomeration. We determined the optical band gap using the simple diffuse reflectance spectroscopy. Experimental Synthesis CdSO4⋅2.5H2O was dissolved in 1 L of deionized water to a concentration of 2 mM. This solution was placed in a 2 L reaction vessel. Under stirring (200 rpm) 18 mmol of 1-thioglycerol were added and the mixture was stirred for an additional five minutes. Ammonium sulfide (30 mmol) was rapidly added under ambient conditions to form cadmium sulfide nanoparticles. This method yields dispersions that are stable even during months. Characterization Microscopy characterization and spectroscopic analyses were carried out using the stable dispersions. XRD and thermal analysis were made using the dried powders obtained by precipitation by means of ionic strength adjustment. X-ray diffraction patterns were recorded with a GBC-Difftech MMA diffractometer. The nickel filtered Cu Kα (λ=1.54 Å) radiation was used at 34.2 mA y 35 kV. Thermogravimetric (TGA) and Differential Scanning Calorimetric (DSC) analysis were carried out with a TA Instruments DCS system, model Q600, using a constant rate of 20ºC/min and nitrogen atmosphere. The morphology was observed with a transmission electron microscopy (TEM). Fluorescence analysis were made with an Ocean Optics SF2000 fiber optic spectrophotometer, the excitation source was a blue Ar+ laser. Absorption measurements were obtained with an Ocean Optics S2000UV-VIS fiber optic spectrometer. Raman spectra was obtained with an Ocean Optics Raman Systems R-2001 Spectrometer with a 785 nm (red) solid-state diode laser. Results and Discussion Figure 1 shows the diffraction pattern of the sample obtained, it was identified comparing with the published data (JCPDS 10-454). The nanoparticles synthesized have good crystallinity and they are in the cubic form (zincblende phase), the average particle size obtained using the diffraction pattern and the MAUD software [15] resulted to be 3.95 nm. | 
| | Figure 1. X-Ray Diffraction pattern of the sample synthesized in this work. | Particle morphology was observed using TEM. Images of sample are presented in Figures 2a and 2b, the particles present good dispersion (the loose agglomeration showed on the images could be due to the preparation technique were the particles are deposited on a copper grid and then the solvent is dried allowing this agglomeration), spherical morphology and their average sizes are under 5 nm, which is consistent with XRD and optical results. 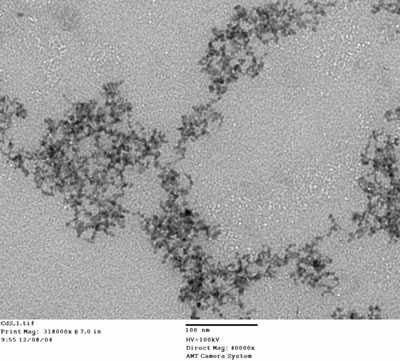
(a) 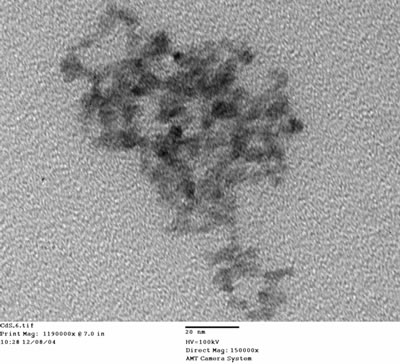
(b) Figure 2. Transmission electron microscopy images of the sample, the scale bar is (a) 100 nm and (b) 20 nm. DSC-TGA measurements were made to reveal the presence of any chemically adsorbed species (Figure 3). The sample presents a mass loss of 10% at 80°C, this mass loss can be ascribed to the desorption of 3-mercapto-1,2-propanediol molecules. The presence of molecules adsorbed on particle surface was confirmed with Raman analysis, in Figure 4 we can see the Raman spectrum of the samples obtained, it shows peaks corresponding to CdS and peaks corresponding to organic molecules. 
Figure 3. DSC-TGA curves for the CdS nanoparticles obtained. 
Figure 4. Raman spectra showing CdS and stabilizing agent signals. The CdS nanoparticles frequently display photoluminescence and sometimes display electroluminescence [16] or chemiluminescence [17], the particles obtained in this work emit light in the red portion of the spectra, Figure 5 shows the emission spectra of the nanoparticles obtained, it has a broad band with a maximum around 660 nm. 
Figure 5. Emission curve of the sample. The sample is red emitter. A fundamental property of semiconductor compounds is the band gap, the energy separation between the filled valence band and the empty conduction band. Cadmium sulfide is a direct band gap semiconductor with a band gap value of 2.4 eV in the bulk form. We calculated the band gap of sample in order to determine if there is a “size quantization” effect in the synthesized materials. Optical excitation of electrons across the band gap is strongly allowed, producing an abrupt increase in absorptivity at the wavelength corresponding to the gap energy. This feature in the optical spectrum is known as the optical absorption edge. Diffuse reflectance spectroscopy can be used to determine the optical absorption edge [18, 19]. The ideal diffuse reflectance spectrum consists of a nearly flat, low absorbance region at long wavelengths that abruptly transforms to a steeply rising absorption edge at shorter wavelengths. The most direct way of extracting the optical band gap is to simply determine the wavelength at which the extrapolations of the base line and the absorption edge cross. Figure 6 shows the absorption analysis using this method, the band gap value obtained was 2.57 eV, this value is shifted compared with the bulk value and this could be a consequence of a “size quantization” effect in the sample. As expected, reduction in particle size gives a shift in the optical band gap of the sample. 
Figure 6. Energy band gap of the sample obtained using UV-VIS spectroscopy. With the band gap value, we calculated particle radius using,  [20] [20]
where Eg is the band gap value of the nanoparticles, Eg,0 is the band gap value of the bulk material, 
and me and mh are effective masses of electrons and holes respectively. The particle radius thus calculated is 3.59 nm, which is in good agreement with Rietveld analysis. Conclusions Cadmium sulfide nanoparticles with less of 4 nm in diameter were synthesized using a simple aqueous precipitation method. This method is fast, not expensive and it can be performed under ambient conditions. Reduction in particle size gives a shift in the optical band gap of the particles. Also, they present luminescence in the red portion of the spectra. Finally, an important practical result concerning the synthesis method is that the obtained nanoparticles are produced in gram scale. References 1. G. A. Martínez-Castañón, M. G. Sánchez-Loredo, H. J. Dorantes, J. R. Martínez Mendoza, G. Ortega-Zarzosa and F. Ruiz, “Characterization of silver sulfide nanoparticles synthesized by a simple precipitation method” Mat. Lett., 59 (2005) 529-534. 2. C. Li and N. Murase, “Synthesis of Highly Luminescent Glasses Incorporating CdTe Nanocrystals through Sol-Gel Processing”, J. Surf. and Coll., 20 (2004) 1-4. 3. A. Schroedter, H. Weller, R. Eritja, W. E. Ford and J. M. Wessels, “Biofunctionalization of Silica-Coated CdTe and Gold Nanocrystals”, Nano Lett., 2 (2002) 1363-1367. 4. L. Spanhel, M. Haase, H. Weller and A. Henglein, “Surface modification and stability of strong luminescing CdS particles”, J. Am. Chem. Soc., 109 (1987) 5649-5655. 5. A. Eychmüller, “Structure and Photophysics of Semiconductor Nanocrystals”, J. Phys. Chem., B 104 (2000) 6514-6528. 6. J. E. Katari, V. L. Colvin and A. P. Alivisatos, “X-ray Photoelectron Spectroscopy of CdSe Nanocrystals with Applications to Studies of the Nanocrystal Surface “J. Phys. Chem., 98 (1994) 4109-4117. 7. C. B. Murray, D. J. Noms and M. G. Bawendi, “Synthesis and Characterization of Nearly Monodisperse CdE (E = S, Se, Te) Semiconductor Nanocrystallites”, J. Am. Chem. Soc., 115 (1993) 8706-8715. 8. T. Vossmeyer, L. Katsikas, M. Giersig, I. Popovik, K. Diesner, A. Chemseddine, A. Eychmüller and H. Weller, “CdS Nanoclusters: Synthesis, Characterization, Size Dependent Oscillator Strength, Temperature Shift of the Excitonic Transition Energy, and Reversible Absorbance Shift”, J. Phys. Chem., 98 (1994) 7665-7673. 9. C. M. Niemeyer, “Nanoparticles, Proteins, and Nucleic Acids: Biotechnology Meets Materials Science”, Angew. Chem. Int. Ed., 40 (2001) 4128-4158. 10. L. Tan, L. Liu, Q. Xie, Y. Zhang and S. Yao, “Fluorescence Quenching of Bovine Serum Albumin in Reversed Micelles by CdS Nanoparticles”, Anal. Sciences, 20 (2004) 441-444. 11. R. Mahtab, J. P. Rogers and C. J. Murphy, “Protein-Sized Quantum Dot Luminescence Can Distinguish between Straight”, “Bent”, and “Kinked” Oligonucleotides”, J. Am. Chem. Soc., 117 (1995) 9099-9100. 12. R. Mahtab, J. P. Rogers, C. P. Singleton and C. J. Murphy, “Preferential Adsorption of a “Kinked” DNA to a Neutral Curved Surface: Comparisons to and Implications for Nonspecific DNA-Protein Interactions”, J. Am. Chem. Soc., 118 (1996) 7028-7032. 13. M. Braun, C. Burda and M. A. El-Sayed, “Variation of the Thickness and Number of Wells in the CdS/HgS/CdS Quantum Dot Quantum Well System”, J. Phys. Chem., A 105 (2001) 5548-5551. 14. A. Mews, A. Eychmüller, M. Giersig, D. Schoos and H. Weller, “Preparation, characterization, and photophysics of the quantum dot quantum well system cadmium sulfide/mercury sulfide/cadmium sulfide”, J. Phys. Chem., 98 (1994) 934-941. 15. L. Lutterotti, S. Matthies and H.-R. Wenk, “MAUD (Material Analysis Using Diffraction): a user friendly {Java} program for {Rietveld} Texture Analysis and more”, Proceeding of the Twelfth International Conference on Textures of Materials (ICOTOM-12), 1 (1999) 1599. 16. J. R. Lakowicz, I. Gryczynski, Z. Gryczynski and C. J. Murphy, “Luminescence Spectral Properties of CdS Nanoparticles”, J. Phys. Chem., B 103 (1999) 7613-7620. 17. S. K. Poznyak, D. V. Talapin, E. V. Shevchenko and Horst Weller, “Quantum Dot Chemiluminescence”, Nano Lett., 4 (2004) 693-698. 18. S. Boldish and W. White, “Optical band gaps of selected ternary sulfide minerals”, American Mineralogist, 83 (1998) 865-871. 19. V. Kumar, S. Sharma, T. Sharma and V. Singh, “Band gap determination in thick films from reflectance measurements”, Optical Materials, 12 (1999) 115-119. 20. V. I. Klimov, “Semiconductor and Metal Nanocrystals”, Marcel Dekker, Inc., New York, (2004) pp.1-2. Contact Details |