Apr 24 2012
Capillary isoelectric focusing (cIEF) separation for characterizing therapeutic proteins has been increasingly adopted in recent years.The determination of pI adds a critical dimension to establishing the identity, purity, post-translational modification, and stability of therapeutic protein preparations. A significant proportion of cIEF analyses being carried out in the biopharmaceutical industry involve the characterization of therapeutic monoclonal antibodies (mAbs). Many mAbs have charge isoforms with a pI in the basic range of the pH gradient.
Image Credit: Yurchanka Siarhei/Shutterstock.com
Basic compounds offer a challenge in cIEF due to the inadequate nature of ampholytes comprising the basic region as well as the decay of the hole pH gradient over time. The addition of cathodic and anodic stabilizers to the cIEF sample solution helps overcome these obstacles. Additionally, optimization of stabilizer solution volumes, focusing times, and ampholyte concentration enable the development of a single method that can be used throughout the complete pH range. This strategy enables the development of a single protocol for product pipeline characterization also referred to as a platform method.
This is an important point due to the need for simplicity and versatility in the biopharmaceutical industry. The result of these efforts is the development of a robust and portable analytical technique less prone to operator error or system variation.
Methods
Preparation of mAb Samples
The preparation of mAb samples is performed as listed below:
- A 500 μL volume of a basic therapeutic mAb (5-10 mg/mL) is thawed and loaded into a Microcon* Ultracell YM 10 (p/n A11530, Millipore, Billerica, MA).
- After centrifugation for 5 min in a Microfuge 18 (p/n 367160, Beckman Coulter, Inc., Fullerton, CA) at 12 k rcf, the filtered volume is replaced with 20 mM Tris buffer pH 8.0.
- Two additional cycles of centrifugation and buffer replacement is done and the desalted sample is aliquoted into approximately 50 μg fractions and stored at -20 °C or below.
Capillaries and Reagents
The following steps are performed with respect to capillaries and reagents:
- A Beckman Coulter 50 μm i.d. Neutral Capillary (p/n 477441) is installed in a Capillary Cartridge equipped with a 200-μm aperture.
- Before installation, the capillary was measured so that its total length was 30.2 cm and the length from inlet to detection window was 20 cm and from the outlet to the detection window was 10 cm.
- Anolyte solutions containing 200 mM phosphoric acid were prepared as a 40 mL bulk, by diluting 550 mL of 85% (w/v) (14.6 M) phosphoric acid (Sigma 438081) with 39.5 mL of double-deionized (DDI) water.
- Catholyte solutions containing 300 mM sodium hydroxide were prepared as a 40 mL bulk by diluting 12 mL of 1 M sodium hydroxide (Sigma p/n 72082) into 28 mL DDI water.
- Chemical mobilizer solutions containing 350 mM acetic acid were prepared as a 40 mL bulk by diluting 0.8 mL of glacial acetic acid (99.8%), 17.4 M (Sigma p/n 537020) into 39 mL of DDI water.
Table 1. Master Mix Preparation. A cIEF master mix solution was made by mixing the appropriate component volumes. These volumes include a 20% overage volume to account for pipetting error. The single portion composition of the master mix contained 12 μL of Pharmalyte* 3-10 (GE Healthcare p/n 17-0456-01), 20 μL of 500 mM L-arginine, 2 μL of 200 mM IDA, 1.0 μL of 1.25 mM peptide pI markers, and 200 μL of 3 M ureacIEF Gel.
| Reagent |
Single Sample Volume μL |
|
3 Sample Master Mix Volume μL |
| 3M Urea-cIEF Gel |
200 |
x3.2 |
640 |
| Pharmalyte 3-10 Carrier Ampholytes |
12 |
x3.2 |
38.4 |
| 500 mM Arginine Cathodic Stabilizer |
20 |
x3.2 |
64 |
| 200 mM IDA Anodic Stabilizer |
2 |
x3.2 |
6.4 |
| Synthetic Peptide pl 10 Marker |
1 |
x3.2 |
3.2 |
| Synthetic Peptide pl 7.0 Marker |
1 |
x3.2 |
3.2 |
Application Information
The steps followed to obtain the capillary cleaning solution are listed below:
- Capillary cleaning solution was made as a bulk solution by dissolving 10.8 g of urea (Sigma p/n U0631) in 30 mL of DDI water.
- Capillary cleaning solution was mixed until all solids dissolved and were then filtered through an Acrodisc* 25-mm syringe filter with a 5-μm pore (Pall p/n 4199) to remove particles.
- A 3 M urea-cIEF gel solution was prepared by dissolving 1.80 g of urea (Sigma p/n U1250) in 9 mL of cIEF gel (p/n 477497), mixed for 15 min and loaded into a 30-mL syringe (Becton Dickenson p/n 309650) and then filtered using a 5-μm pore Acrodisc 25-mm syringe filter (Pall p/n 4199) to remove particles.
- The 3 M urea-cIEF gel solution was degassed at 2,000 rcf with an Allegra X 15 R centrifuge (Beckman Coulter p/n 392933) and stored at 2-8 °C.
- Cathodic stabilizer solution comprising 500 mM Larginine was made as a 50 mL bulk by first dissolving 4.36 g of L-arginine (98%) (Sigma p/n A5006) solid with 35 mL of DDI water in a 50 mL volumetric flask, then the volumetric flask was shaken for 15 min to dissolve and finally increasing the volume to 50 mL with DDI water.
- Anodic stabilizer solution containing 200 mM iminodiacetic acid (IDA) was made as a 50 mL bulk by first dissolving 1.33 g of iminodiacetic acid (98%) (Sigma p/n 220000) solid with 35 mL DDI water in a 50 mL volumetric flask.
- The mixture was shaken for 15 min to dissolve all solids and the volume was increased to 50 mL using DDI water.
- The mAb buffer replacement solution which contained 20 mM Tris was made by diluting 4 mL of 50 mM Tris buffer at pH 8.0 (p/n 477427) with 6 mL of DDI water.
Table 2. Sample Preparation. Following mixing of the 240 μL master mix, it was added to a tube containing an aliquot of desalted mAb. The complete sample solution was then vortexed, 200 μL was transferred into a PCR tube, overlaid with a single drop of mineral oil (Sigma p/n 8410-5ML) and placed in a sample vial.
| |
10 mg/mL mAb |
5mg/mL mAb |
| Master Mix |
240 |
240 |
| Desalted mAb |
5 |
10 |
Instrument Configuration
The configuration of the instrument is as follows:
- The Beckman Coulter PA 800 Protein Characterization System is equipped with a UV detector and a 280-nm filter with a band pass of +/- 10 nm.
- The detector is set to detect direct absorbance at a collection rate of 2 Hz.
- The electronic filter is set at the normal setting, with a peak width setting of 16 to 25.
- All separations were performed at a capillary temperature setting of 20 °C. The system auto sampler was set to a temperature of 10 °C.
Conditioning Method
The conditioning procedure followed is listed below:
- After initial installation of the capillary cartridge, the neutral capillary is conditioned by first performing a water rinse by submerging the inlet of the capillary into a glass vial containing 1.8 mL of DDI water and applying 50 psi of pressure from the inlet side for 2 min.
- The extended water rinse is followed by a weak acid wash performed by submerging the inlet of the capillary into a vial containing 1.8 mL of chemical mobilizer and applying 50 psi of pressure from the inlet side for 2 min.
- Finally a conditioning rinse is performed by submerging the inlet of the capillary into a vial containing 1.8 mL of Beckman Coulter cIEF gel and applying 50 psi of pressure from the inlet side for 5 min.
Platform cIEF Separation Method
The Platform cIEF
The mAb samples were separated using the following separation method:
- The capillary is first cleaned by submerging the inlet of the capillary into a vial containing 1.8 mL of capillary cleaning solution and applying pressure at 50 psi from the inlet side for 3 min.
- Following the capillary cleaning solution rinse step, the capillary is flushed with water by submerging the inlet of the capillary into a vial containing 1.8 mL DDI water and applying 50 psi of pressure from the inlet side for 2 min.
- The mAb CIEF sample solution is introduced into the capillary by applying 25 psi of pressure for 99.9 sec from the inlet side of the capillary.
- During the cleaning, water rinse and sample loading steps, the outlet side of the capillary is placed into a waste vial.
- After sample injection, the gradient is focused by submerging the inlet side of the capillary into a vial containing 1.8 mL of anolyte and the outlet side of the capillary into a vial containing 1.8 mL of catholyte and applying a 25 kV electrical potential across the capillary for 15 min.
- The focused peaks are mobilized chemically during which the catholyte solution is replaced with a vial containing 1.8 mL of chemical mobilizer and applying a 30 kV electrical potential across the capillary for 20 min.
- After completion of the mobilization step, data collection is stopped and a water rinse step is performed by submerging the inlet of the capillary into a vial containing 1.8 mL DDI water and applying 50 psi of pressure from the inlet side for 2 min.
Shutdown Method
The shutdown method involves the following:
- The instrument is shut down and the capillary is stored on the instrument at the end of the working day using a shutdown method that first equilibrated the capillary by submerging the inlet of the capillary into a vial containing 1.8 mL of DDI water and applying 50 psi of pressure from the inlet side for 2 min.
- After the water rinse, a conditioning rinse is performed by submerging the inlet of the capillary into a vial containing 1.8 mL of Beckman Coulter cIEF gel and applying 50 psi of pressure from the inlet side for 10 min.
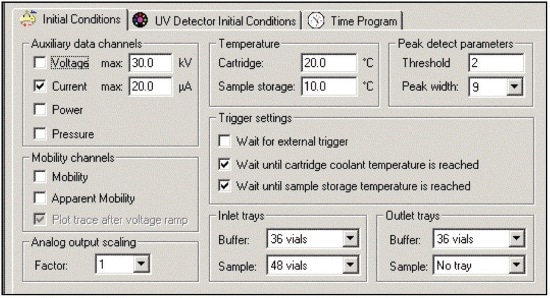
Figure 1. Initial Conditions. Image credit: Beckman Coulter
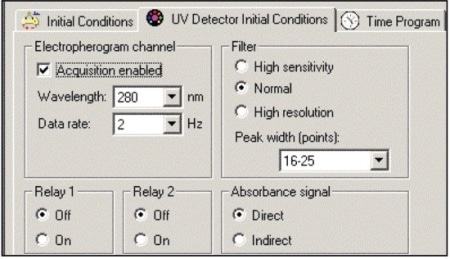
Figure 2. Detector Settings. Image credit: Beckman Coulter
Buffer Tray Set-up
Glass vials containing 1.6 mL of cIEF separation reagents were placed in the buffer trays prior to separation in the order illustrated in Figure 3. The capillary cleaning solution is designated by the abbreviation “Cap Clean Sol.” and chemical mobilizer by “Chem. Mob.” Arrows show the reagents that are incremented by the Basic pH Gradient cIEF Separation Method and the direction of incrementing.
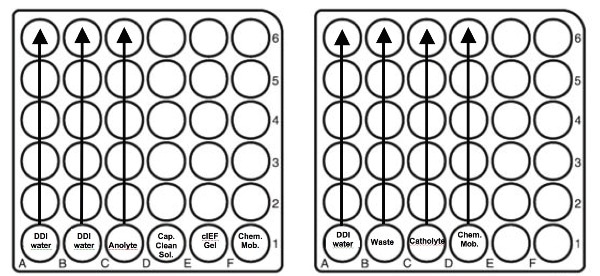
Figure 3. Buffer Tray Set-up. Image credit: Beckman Coulter
Results
pH Gradient Range and Linearity
The effective separation range and linearity for the ampholyte buffered pH are essential factors in cIEF. The cIEF separations of a panel of synthetic peptide markers with pI points spanning the pH range of 4.1 to 10 (Table 3) were performed using the basic pH range method to assess linearity. This separation (Fig. 4) shows that the method has a wide functional range and is even capable of separating the acidic peptide markers when the mobilization time is extended.
Table 3. pI Marker Detection Times. Contains the pI points, amino acid sequences and detection times for the pI markers separation in Figure 4.
| pI Marker |
Amino Acid Sequence |
Mobilization Time Min |
| 10.0 |
H-Trp-Tyr-Lys-Lys-OH |
22.408 |
| 9.5 |
H-Trp-Tyr-Tyr-Lys-Lys-OH |
23.462 |
| 8.4 |
H-Trp-Glu-Tyr-Tyr-Lys-Lys-OH |
27.375 |
| 7.0 |
H-Trp-Glu-His-Arg-OH |
29.429 |
| 6.7 |
H-Trp-Glu-His-Arg-OH |
29.892 |
| 5.5 |
H-Trp-Glu-His-OH |
32.808 |
| 4.1 |
H-Trp-Asp-Asp-Arg-OH |
36.683 |
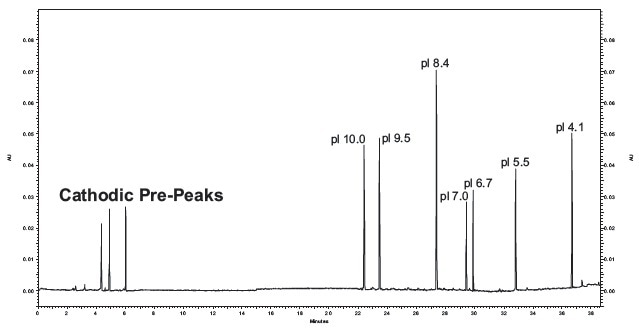
Figure 4. cIEF Separations of Synthetic Peptide pI Markers. It contains an electropherogram of seven synthetic peptide markers using the basic pH gradient cIEF separation method. The mobilization step was extended from 35 to 40 minutes to enable the detection of the pI 4.1 marker. Image credit: Beckman Coulter
Analysis of pI versus detection time (Fig. 5) for the synthetic peptide markers shows that the gradient is linear between pH 10 and 4.1 with a correlation coefficient of 0.99. Highly basic protein species not properly focused are sometimes mistaken as salt fronts. This is shown in Figure 4 as the cathodic pre-peaks.
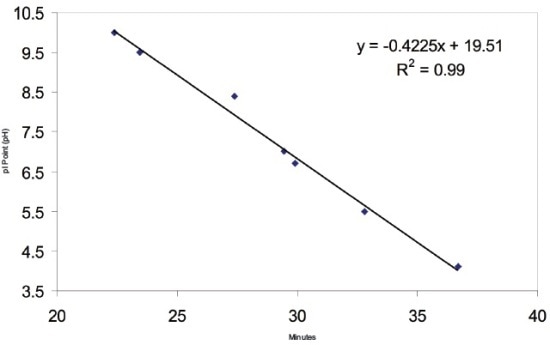
Figure 5. pI Marker Linear Model. A plot of pI values versus detection time observed for separation of synthetic peptides as summarized in Table 1. The mobilization of the pI markers fits a linear model with a correlation coefficient of 0.99 indicating that the mobilized pH gradient is highly linear. Image credit: Beckman Coulter
Separation of Three mAbs
mAbs tend to generate complex charge isoform profiles when separated by cIEF. These profiles in addition to actual pI values for the peaks generate a “mAb” fingerprint. It is for this reason that cIEF can be a powerful tool in the identification and characterization of separate mAb preparations. The unique peak profile for different mAbs shows that a single method using a broad pH 3 to 10 ampholyte mixture is capable of resolving differences in pI up to a few hundredths of 1 pH unit across the basic range of the gradient (Fig. 6).
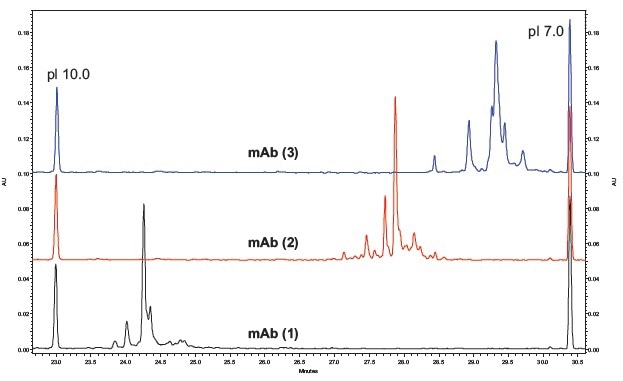
Figure 6. cIEF Separations of Three Basic mAb’s. Electropherograms for three basic mAbs separated by cIEF using the same conditions as shown in Figure 4. Image credit: Beckman Coulter
Reproducibility of mAb Separation
In order to test intermediate precision for this method, a panel of three antibodies was separated on two instruments using two different lots of neutral capillary and reagents on six separate days. All data was integrated using 32 KaratTM software. pI was determined through the qualitative analysis tool using the detection times of pI 10 and 7 synthetic peptide markers. The peaks were grouped into one of three isoform groups for each mAb, basic, main and acidic, and a percent composition was calculated for each isoform group (Figs. 7-9). The pI point of seven signature peaks and the percent composition of three isoform groups for each of the three mAbs tested were recorded. These recorded values were then used to calculate percent coefficients of variation (%CV) which were used to gauge assay reproducibility.
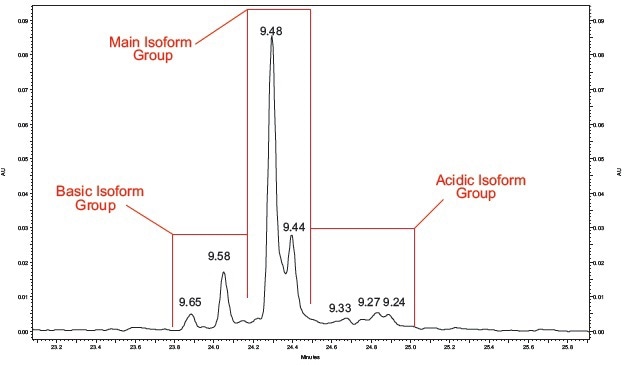
Figure 7. mAb (1) Peak Profile. A close up view of the mAb #1 cIEF separation. Image credit: Beckman Coulter
Table 4. Quantitative Analysis of mAb #1 cIEF Separation. Quantitative analysis was performed using the pI point of seven signature peaks and the percent composition of three isoform groups.
n = 25
Calculated p1 |
| Peaks |
Average |
Std Dev |
CV |
| A |
9.65 |
0.01 |
0.05% |
| B |
9.58 |
0.01 |
0.06% |
| C |
9.48 |
0.01 |
0.07% |
| D |
9.44 |
0.01 |
0.09% |
| E |
9.33 |
0.01 |
0.08% |
| F |
9.27 |
0.01 |
0.07% |
| G |
9.24 |
0.01 |
.08% |
| Isoform Group Percent Composition |
| Group |
Average |
Std Dev |
CV |
| Basic |
13.94% |
0.42% |
3.04% |
| Main |
71.97% |
0.46% |
0.64% |
| Acidic |
14.09% |
0.34% |
2.38% |
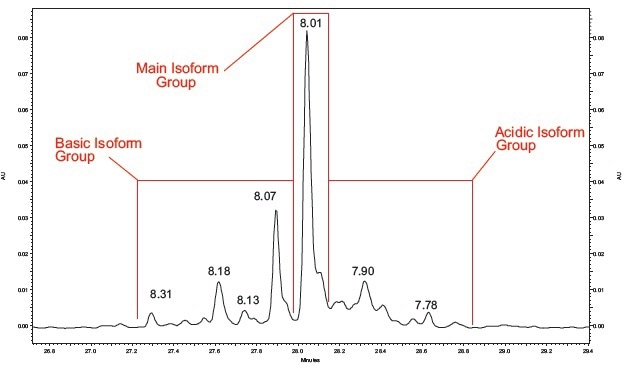
Figure 8. mAb #2 Peak Profile. A close up view of a mAb #2 cIEF separation. Image credit: Beckman Coulter
Table 5. Quantitative Analysis of mAb #2. Quantitative analysis was performed using the same method as mAb #1.
n = 25
Calculated p1 |
| Peaks |
Average |
Std Dev |
CV |
| A |
8.31 |
0.00 |
0.06% |
| B |
8.18 |
0.01 |
0.07% |
| C |
8.13 |
0.01 |
0.07% |
| D |
8.07 |
0.01 |
0.07% |
| E |
8.01 |
0.01 |
0.07% |
| F |
7.90 |
0.01 |
0.07% |
| G |
7.78 |
0.00 |
0.05% |
| Isoform Group Percent Composition |
| Group |
Average |
Std Dev |
CV |
| Basic |
30.97% |
0.67% |
2.17% |
| Main |
45.01% |
0.45% |
0.99% |
| Acidic |
24.02% |
0.60% |
2.50% |
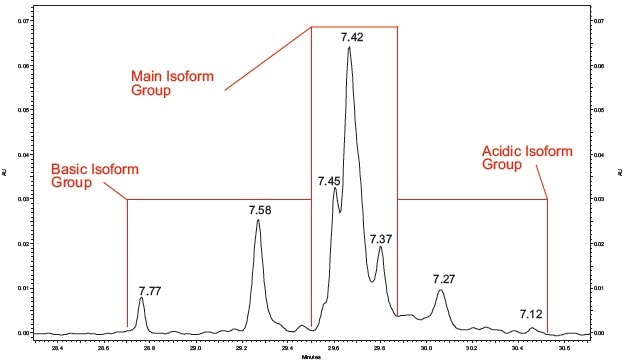
Figure 9. mAb #3 Peak Profile. A close up view of a mAb #3 cIEF separation. Image credit: Beckman Coulter
Table 6. Quantitative Analysis of mAb #3. Quantitative analysis was performed using the same method as mAb #1.
n = 25
Calculated p1 |
| Peaks |
Average |
Std Dev |
CV |
| A |
7.79 |
0.00 |
0.06% |
| B |
7.59 |
0.00 |
0.05% |
| C |
7.46 |
0.00 |
0.06% |
| D |
7.43 |
0.00 |
0.04% |
| E |
7.38 |
0.00 |
0.05% |
| F |
7.28 |
0.01 |
0.07% |
| G |
7.12 |
0.00 |
0.06% |
| Isoform Group Percent Composition |
| Group |
Average |
Std Dev |
CV |
| Basic |
18.03% |
0.28% |
1.53% |
| Main |
68.42% |
0.42% |
0.62% |
| Acidic |
13.55% |
0.34% |
2.49% |
Conclusions
A single separation method can be employed to perform cIEF analysis of multiple mAbs across a broad pH range. The use of a single method enables preparing master separation mixes which can help reduce pipetting errors and inter-sample ariability. Workflow is simplified by using a platform method, reducing the chances for operator error and increasing overall efficiency in method development. The analytical power of the cIEF separation technique is illustrated by the three very different peak profiles produced in each mAb separation. The reproducibility of the separation method was demonstrated by conducting a series of separations on six separate days using multiple instruments with multiple lots of reagents. Statistical analysis of pI and isoform group percent composition confirms that highly reproducible cIEF separations of mAbs can be achieved even in the previously problematic basic region of the pH gradient.

This information has been sourced, reviewed and adapted from materials provided by Beckman Coulter, Inc. - Particle Characterization.
For more information on this source, please visit Beckman Coulter, Inc. - Particle Size Characterization.