Polymorphism is common in all organic molecules, forming more than one unique crystalline forms called polymorphs. This phenomenon is gaining traction especially in the pharmaceutical industry owing to the fact that a compound’s different polymorphs exhibit different physical and chemical properties, including bioavailability, dissolution rate, and thermal stability. These properties influence the dosage and shelf life of drugs.
Significance of Polymorphic Studies
It is essential to perform polymorphic studies during the initial research phase of a potential drug development to identify how many different forms of polymorphs can be generated, and to determine the polymorph that is optimal for pilot production and clinical trials.
The limitations of conventional instruments compel most pharmaceutical manufacturers to perform these analyses only at the development stage instead of the initial research phase, thus complicating or delaying the overall development cycle for new drugs when problems are identified from these analyses. This scenario is now changing, thanks to the increasing adoption of Raman microscopy for polymorph characterization.
Conventional Techniques for Polymorph Characterization
Thermomicroscopy, differential scanning calorimetry (DSC), and X-ray diffraction are the most widely used techniques for polymorph characterization. DSC involves subjecting a trace amount of compound to consecutive heating and cooling cycles and subsequent analysis. The resulting exothermic and endothermic peaks reveal the melting and crystallization status, respectively. The data analysis reveals the number of polymorphs formed and their thermodynamic relationship.
Thermomicroscopy involves successive heating and cooling of the sample in an optical microscope coupled to a temperature–controlled sample stage. This enables direct imaging of the formation of various polymorphs. X-ray diffraction provides definitive crystal analysis and determination on a powdered sample, but cannot be integrated, in situ, with either of the thermal diagnostics. Moreover, the need for a sample volume of at least 20–30mg is often difficult to have in the early research stage.
Advantages of Raman Microscopy
FTIR and Raman spectroscopy are vibrational techniques, providing similar information. However, in contrast to FTIR, visible or near-infrared wavelengths can be used in Raman, enabling it to achieve a spatial resolution down to 1–2µm. As a result, Raman is advantageous in many ways. The Raman spectrometer can be interfaced with the sample through fiber optic for in situ measurements. Remote operation is also possible by making measurements through a packaging material or viewing window.
The weak Raman signal of water enables the Raman spectrometer to observe and characterize even crystals in an aqueous medium. The key advantage is the complete compatibility of the Raman system with optical microscopy, enabling crystal imaging and simultaneous analytical data acquisition at operator-chosen xyz locations in a sample by means of a cross-hair target by the click of a mouse button.
The unprecedented spatial resolution of Raman spectrometers allows characterization of single crystal samples down to a few microns as well as individual crystals in a mixed sample. In addition, the exact spectral position and intensity of Raman peaks of chemical species are characteristic of their corresponding crystal structure. Hence, Raman systems are more suitable for polymorph characterization.
A hot stage can be directly integrated into Raman microscopes as they take measurements using the light that is co-axially backscattered from the sample surface, thereby allowing users to perform both Raman and thermomicroscopy analyses simultaneously. As a result, when a sample is subjected to heating cycles, it is possible to characterize the formation of polymorphs at a single crystal level.
Experimental Procedure and Results
This experiment studied the polymorphism of paracetamol (4-acetamino-phenol) to demonstrate the advantages of Raman microscopy. There are three common polymorphic forms for paracetamol, designated as Form I, Form II and Form III. The commercially preferred polymorphic form is Form I. This analysis used a fiber-coupled RamanRxn1™ Microprobe equipped with a Mettler FP82 hot stage for the sample to be heated and cooled in a controlled manner.
At first, the thermodynamic conditions involved in the formation of each polymorph were confirmed by performing DSC measurements. Then, the Raman microscope was used to observe the formation of various polymorphs by thermally cycling a small amount of sample (<1mg). The experiment results are presented in Figure 1, showing the formation of Form I when the sample is heated to 160°C (large colored crystal plates in the left-side image). The right-side image illustrates the Raman spectra of these crystals that were in situ recorded using an acquisition time of 60s for each spectrum.
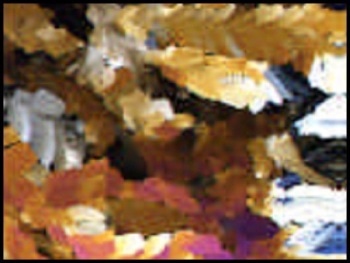
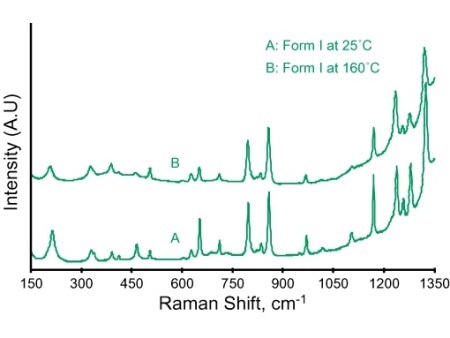
Figure 1. Form I paracetamol crystals: Raman microscopy allow video images and analytical (spectral) information to be simultaneously recorded.
The raman spectra show slight shifts in peak positions with respect to changing sample temperature. Nevertheless, the Raman spectra of the three polymorphic forms can be clearly differentiated by greater peak shifts in different spectral regions (Table 1). Figure 2 depicts the expanded plots, showing the peaks in the spectral region of 1200–1260 cm-1.
Table 1. Characteristic frequencies for unambiguous identification of the polymorphs of paracetamol.
| Raman Shift, cm-1 |
Form III |
Form II |
Form I |
| 1200–1260 |
1241–1244 |
1242 & 1218–1219 |
1254–1258 & 1233–1238 |
| 855–865 |
863–865 |
860 |
857–859 |
| 790–810 |
799–801 |
797–798 |
795–798 |
| 450–470 |
454–458 |
451–452 |
460–466 |
| 200–220 |
212–216 |
200–201 |
207–215 |
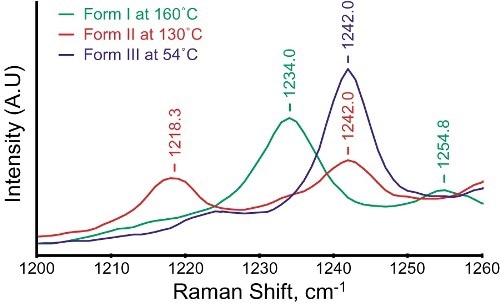
Figure 2. An expanded view of the spectral region between 1200 and 1260cm-1 shows clear differences between the three polymorphs of paracetamol.
Conclusion
With small sample volume and in situ measurement capability, Raman microscopy is ideal for polymorphic identification which helps pharmaceutical companies to streamline their research and development efforts in order to launch new drugs with reduced product development cycles.
About Kaiser Optical Systems
Kaiser Optical Systems, Inc. is a world leader in spectrographic instrumentation and applied holographic technology. Principal products include Raman sensors and instrumentation, advanced holographic components for spectroscopy, and astronomy and ultra-fast sciences. Principal offices and the manufacturing facility are located in Ann Arbor, Michigan.
Their products and services are deployed throughout the world in such diverse applications as pharmaceutical and chemical manufacturing, nanotechnology, telecommunications, education, forensic science, deep-sea exploration, and astronomy. From particles smaller than a human hair to objects as large as planets, their products are providing their customers unique insights into both today’s as well as “age-old” questions.
Kaiser was founded in 1979 to meet the need for diffractive or holographic optics for the avionics market. Kaiser entered the spectroscopy market in 1990 with the introduction of the holographic notch filter. In 1993 Kaiser released their first Raman analyzer, the HoloProbe. In 2013, the company became part of the Endress+Hauser Group.
To better serve the European community, Kaiser opened a new subsidiary in Europe in 1998. Kaiser Optical Systems SARL is located in Lyon, France. Kaiser SARL supervises their distributor network within Europe.

This information has been sourced, reviewed and adapted from materials provided by Kaiser Optical Systems.
For more information on this source, please visit Kaiser Optical Systems.